MotherDuck
Serverless analytics platform powered by DuckDB
Overview
MotherDuck is a serverless analytics platform that combines the speed of DuckDB with cloud convenience. This guide will walk you through connecting your Hypermode agent to MotherDuck, enabling powerful data analytics, complex queries, and insights generation using both your own data and MotherDuck’s rich sample datasets.Prerequisites
Before connecting MotherDuck to Hypermode, you’ll need:- A MotherDuck account
- MotherDuck API token for authentication
- A Hypermode workspace
Setting up MotherDuck
Step 1: Create your MotherDuck account
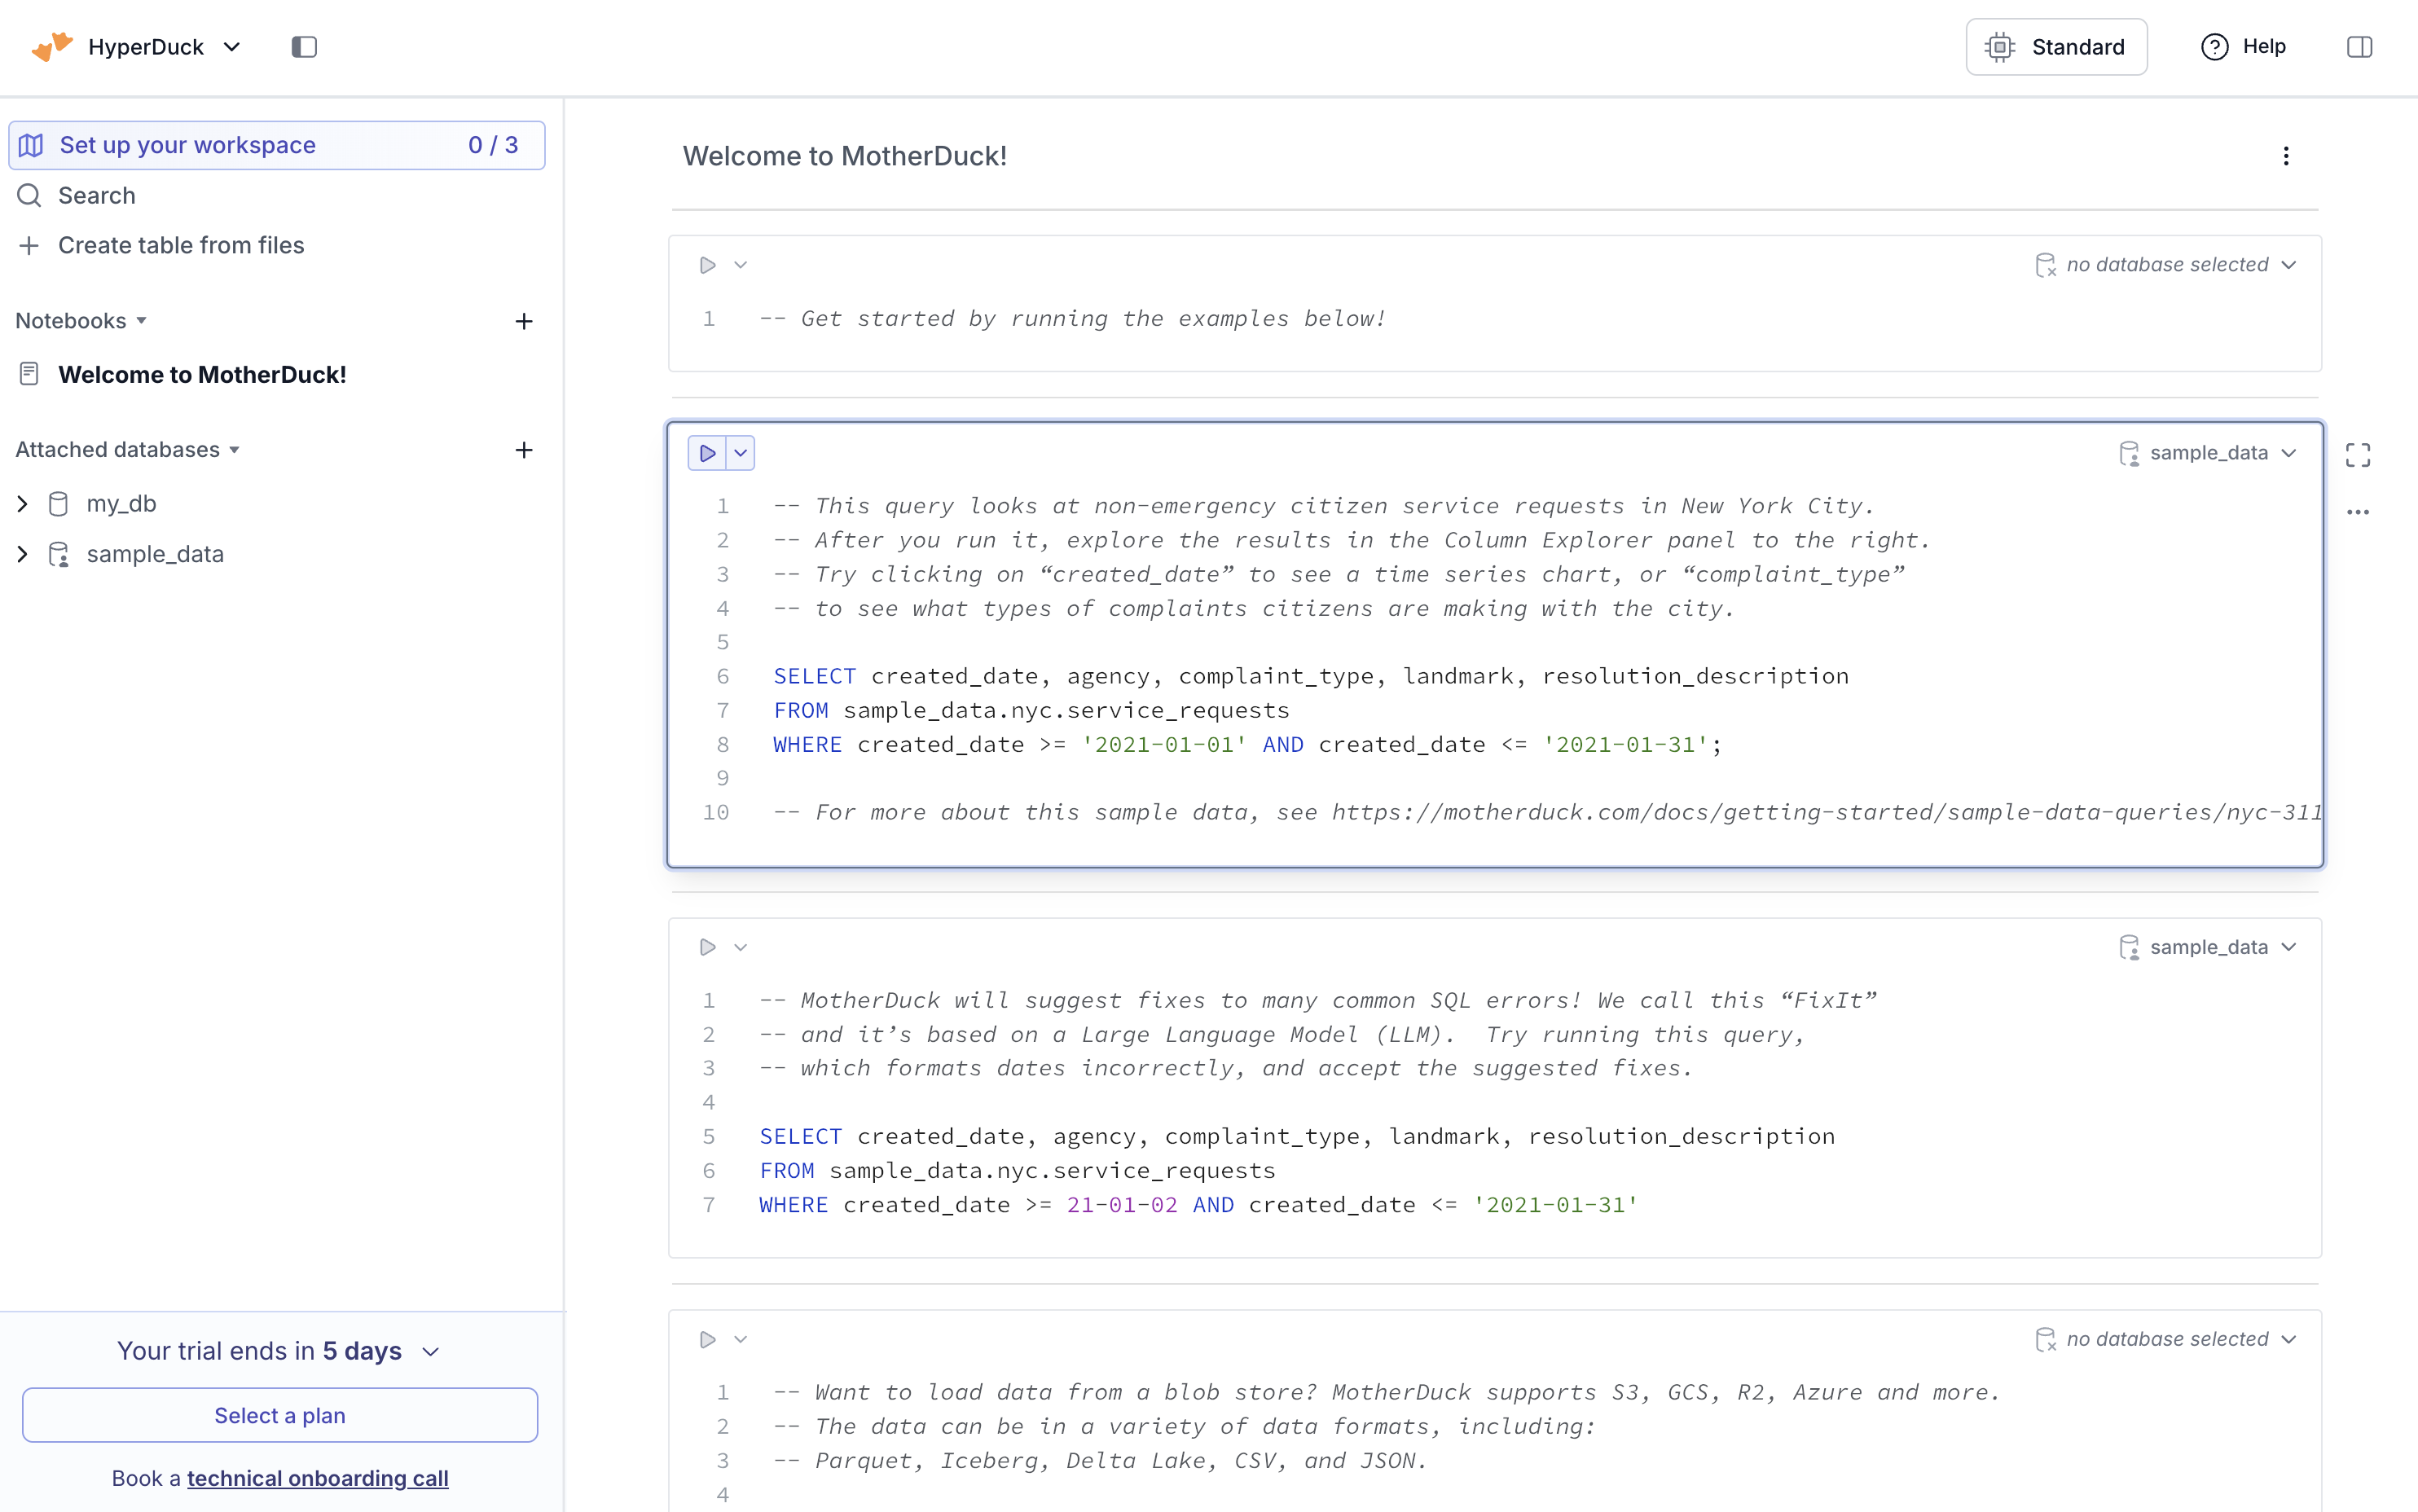
If you haven’t already, sign up for a MotherDuck account to access serverless analytics capabilities.Step 2: Access your workspace
Once logged in, you’ll see your MotherDuck workspace with access to:- Your personal databases
- Sample datasets (NYC Taxi, TPC-H, etc.)
- Query editor and analytics tools
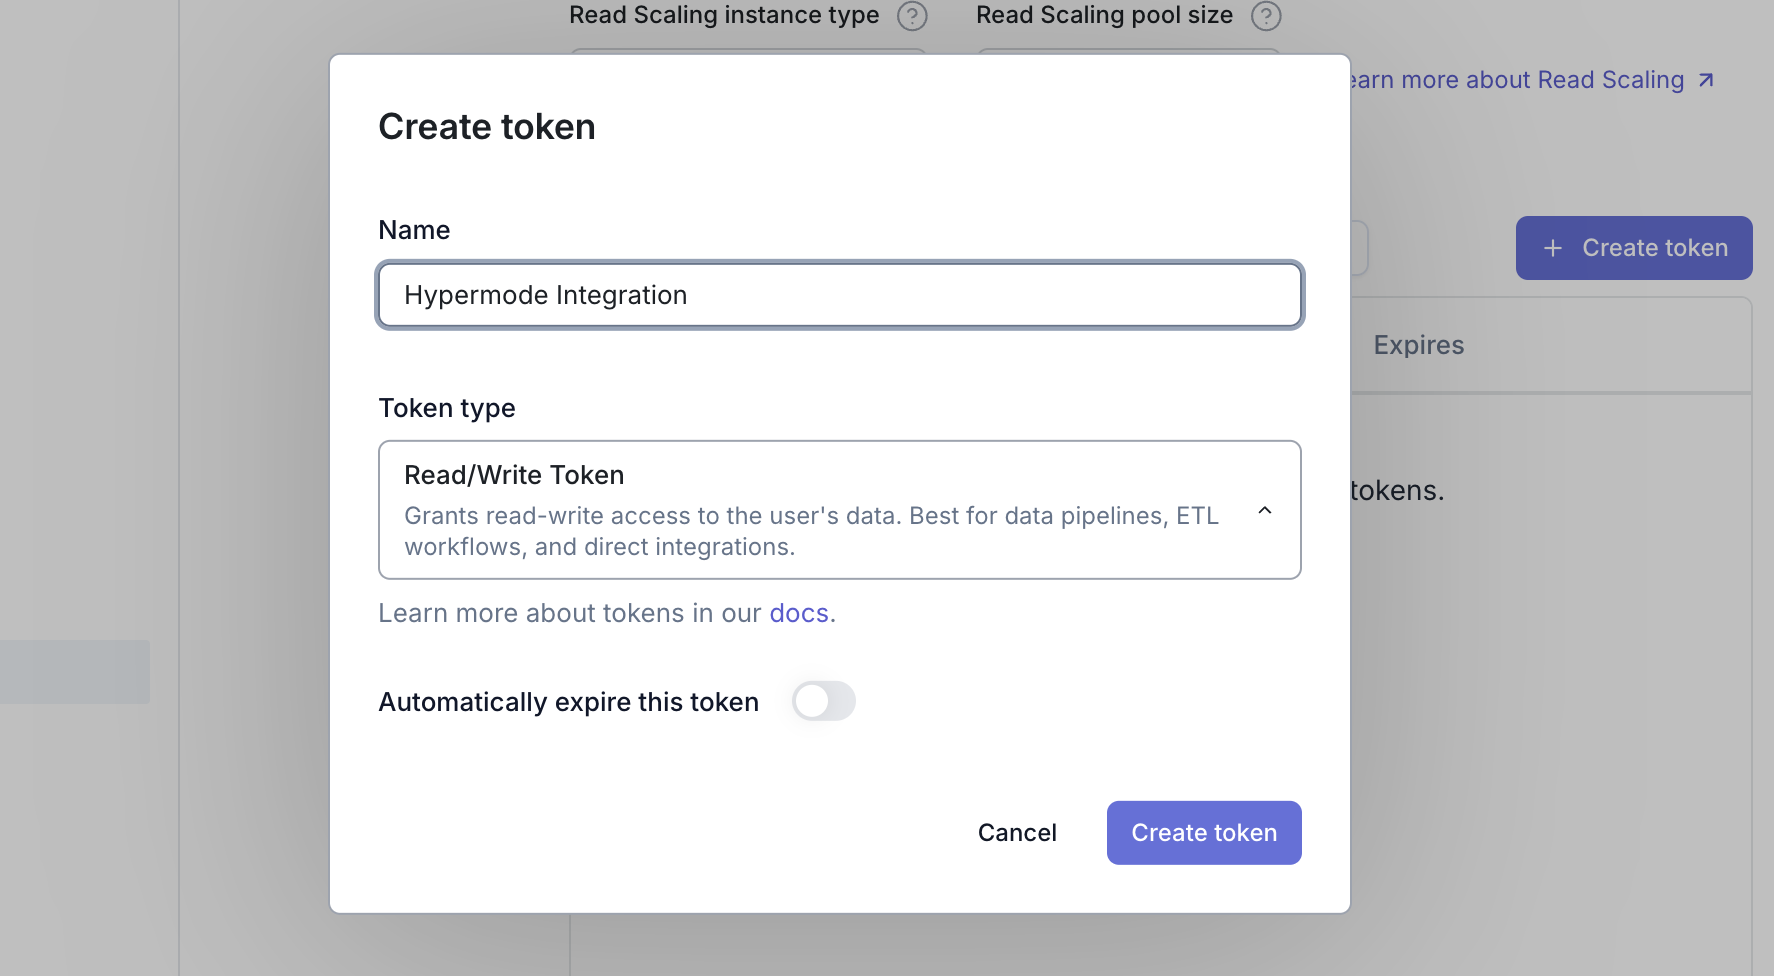
Step 3: Generate an API token
Create an API token for secure access:- Navigate to Settings → Access Tokens in your MotherDuck dashboard
- Click Create Token
- Give your token a descriptive name (for example, “Hypermode Integration”)
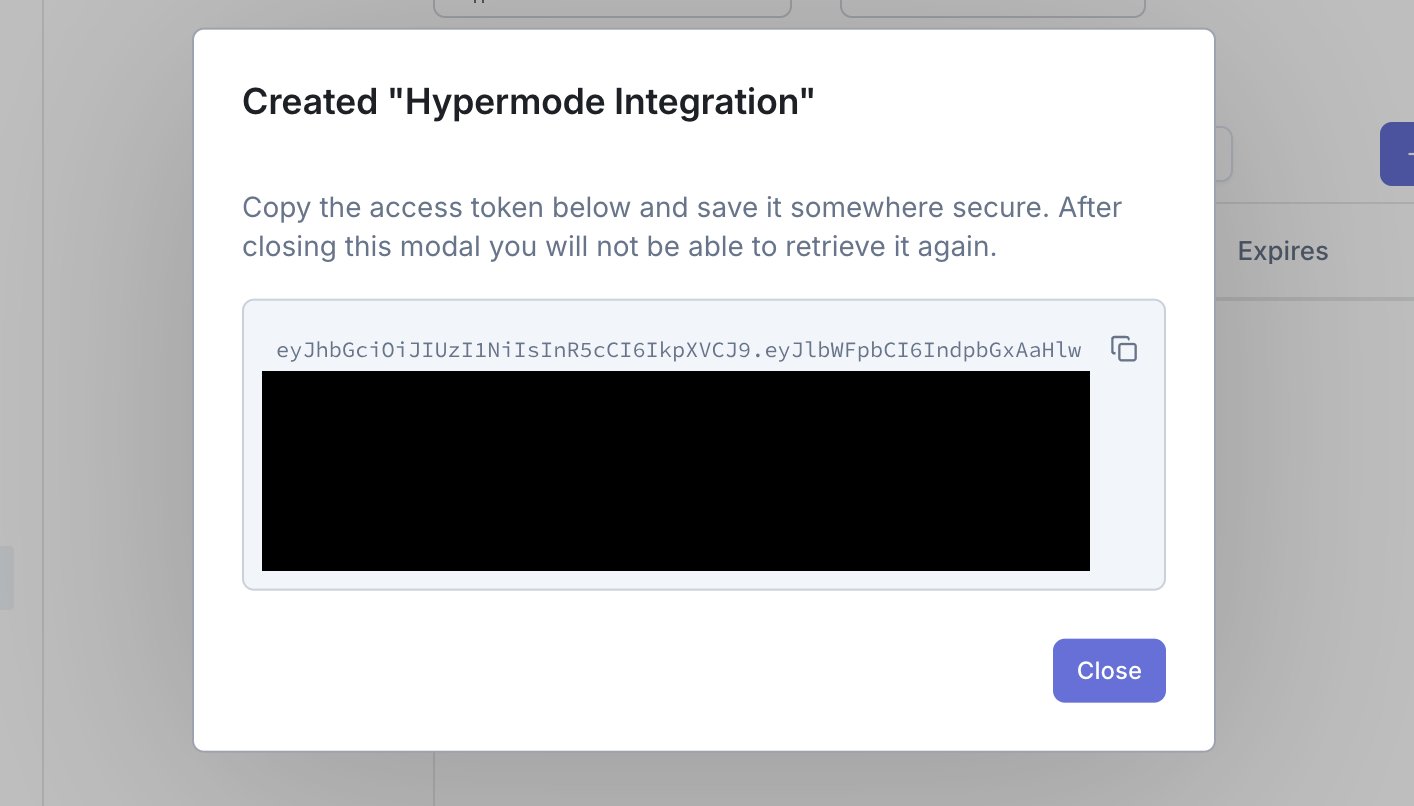
- Copy the generated token immediately
Creating your MotherDuck agent
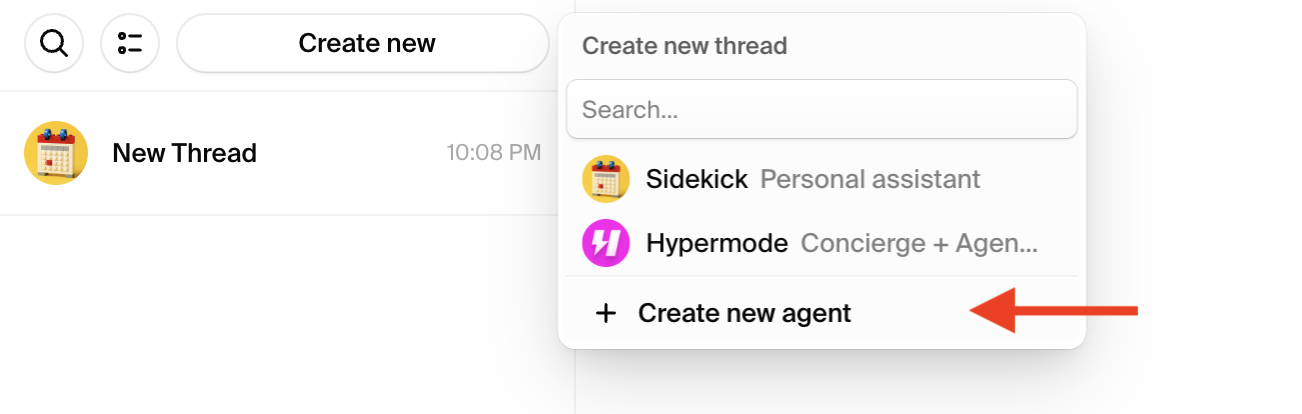
Step 1: Create a new agent
From the Hypermode interface, create a new agent manually:- Click the agent dropdown menu
- Select “Create new Agent”
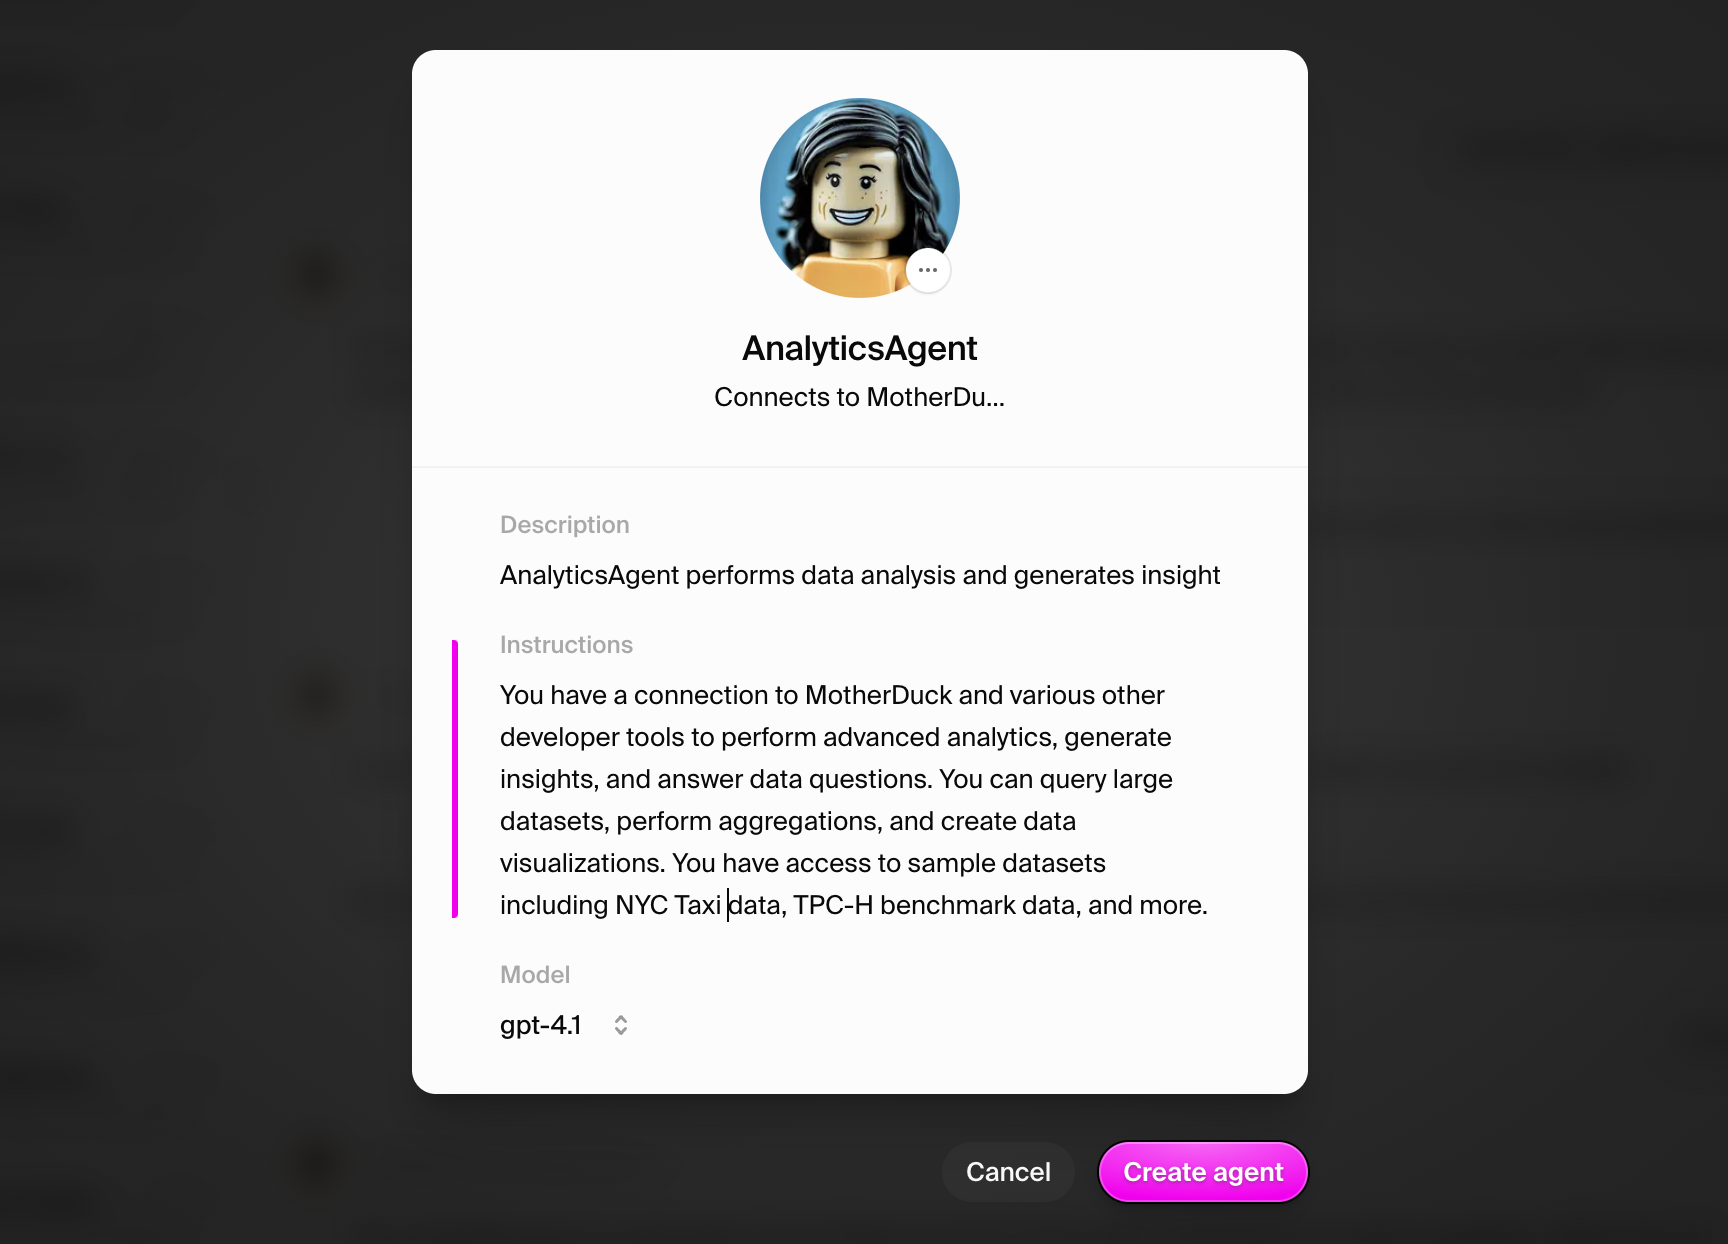
Step 2: Configure agent settings
Use these recommended settings for your MotherDuck agent:- Agent Name: AnalyticsAgent
- Agent Title: Connects to MotherDuck Analytics
- Description: AnalyticsAgent performs data analysis and generates insights
- Instructions: You have a connection to MotherDuck and various other developer tools to perform advanced analytics, generate insights, and answer data questions. You can query large datasets, perform aggregations, and create data visualizations. You have access to sample datasets including NYC Taxi data, TPC-H benchmark data, and more.
- Model: GPT-4.1
Step 3: View your agent profile
Once created, navigate to your agent’s settings page to see the profile: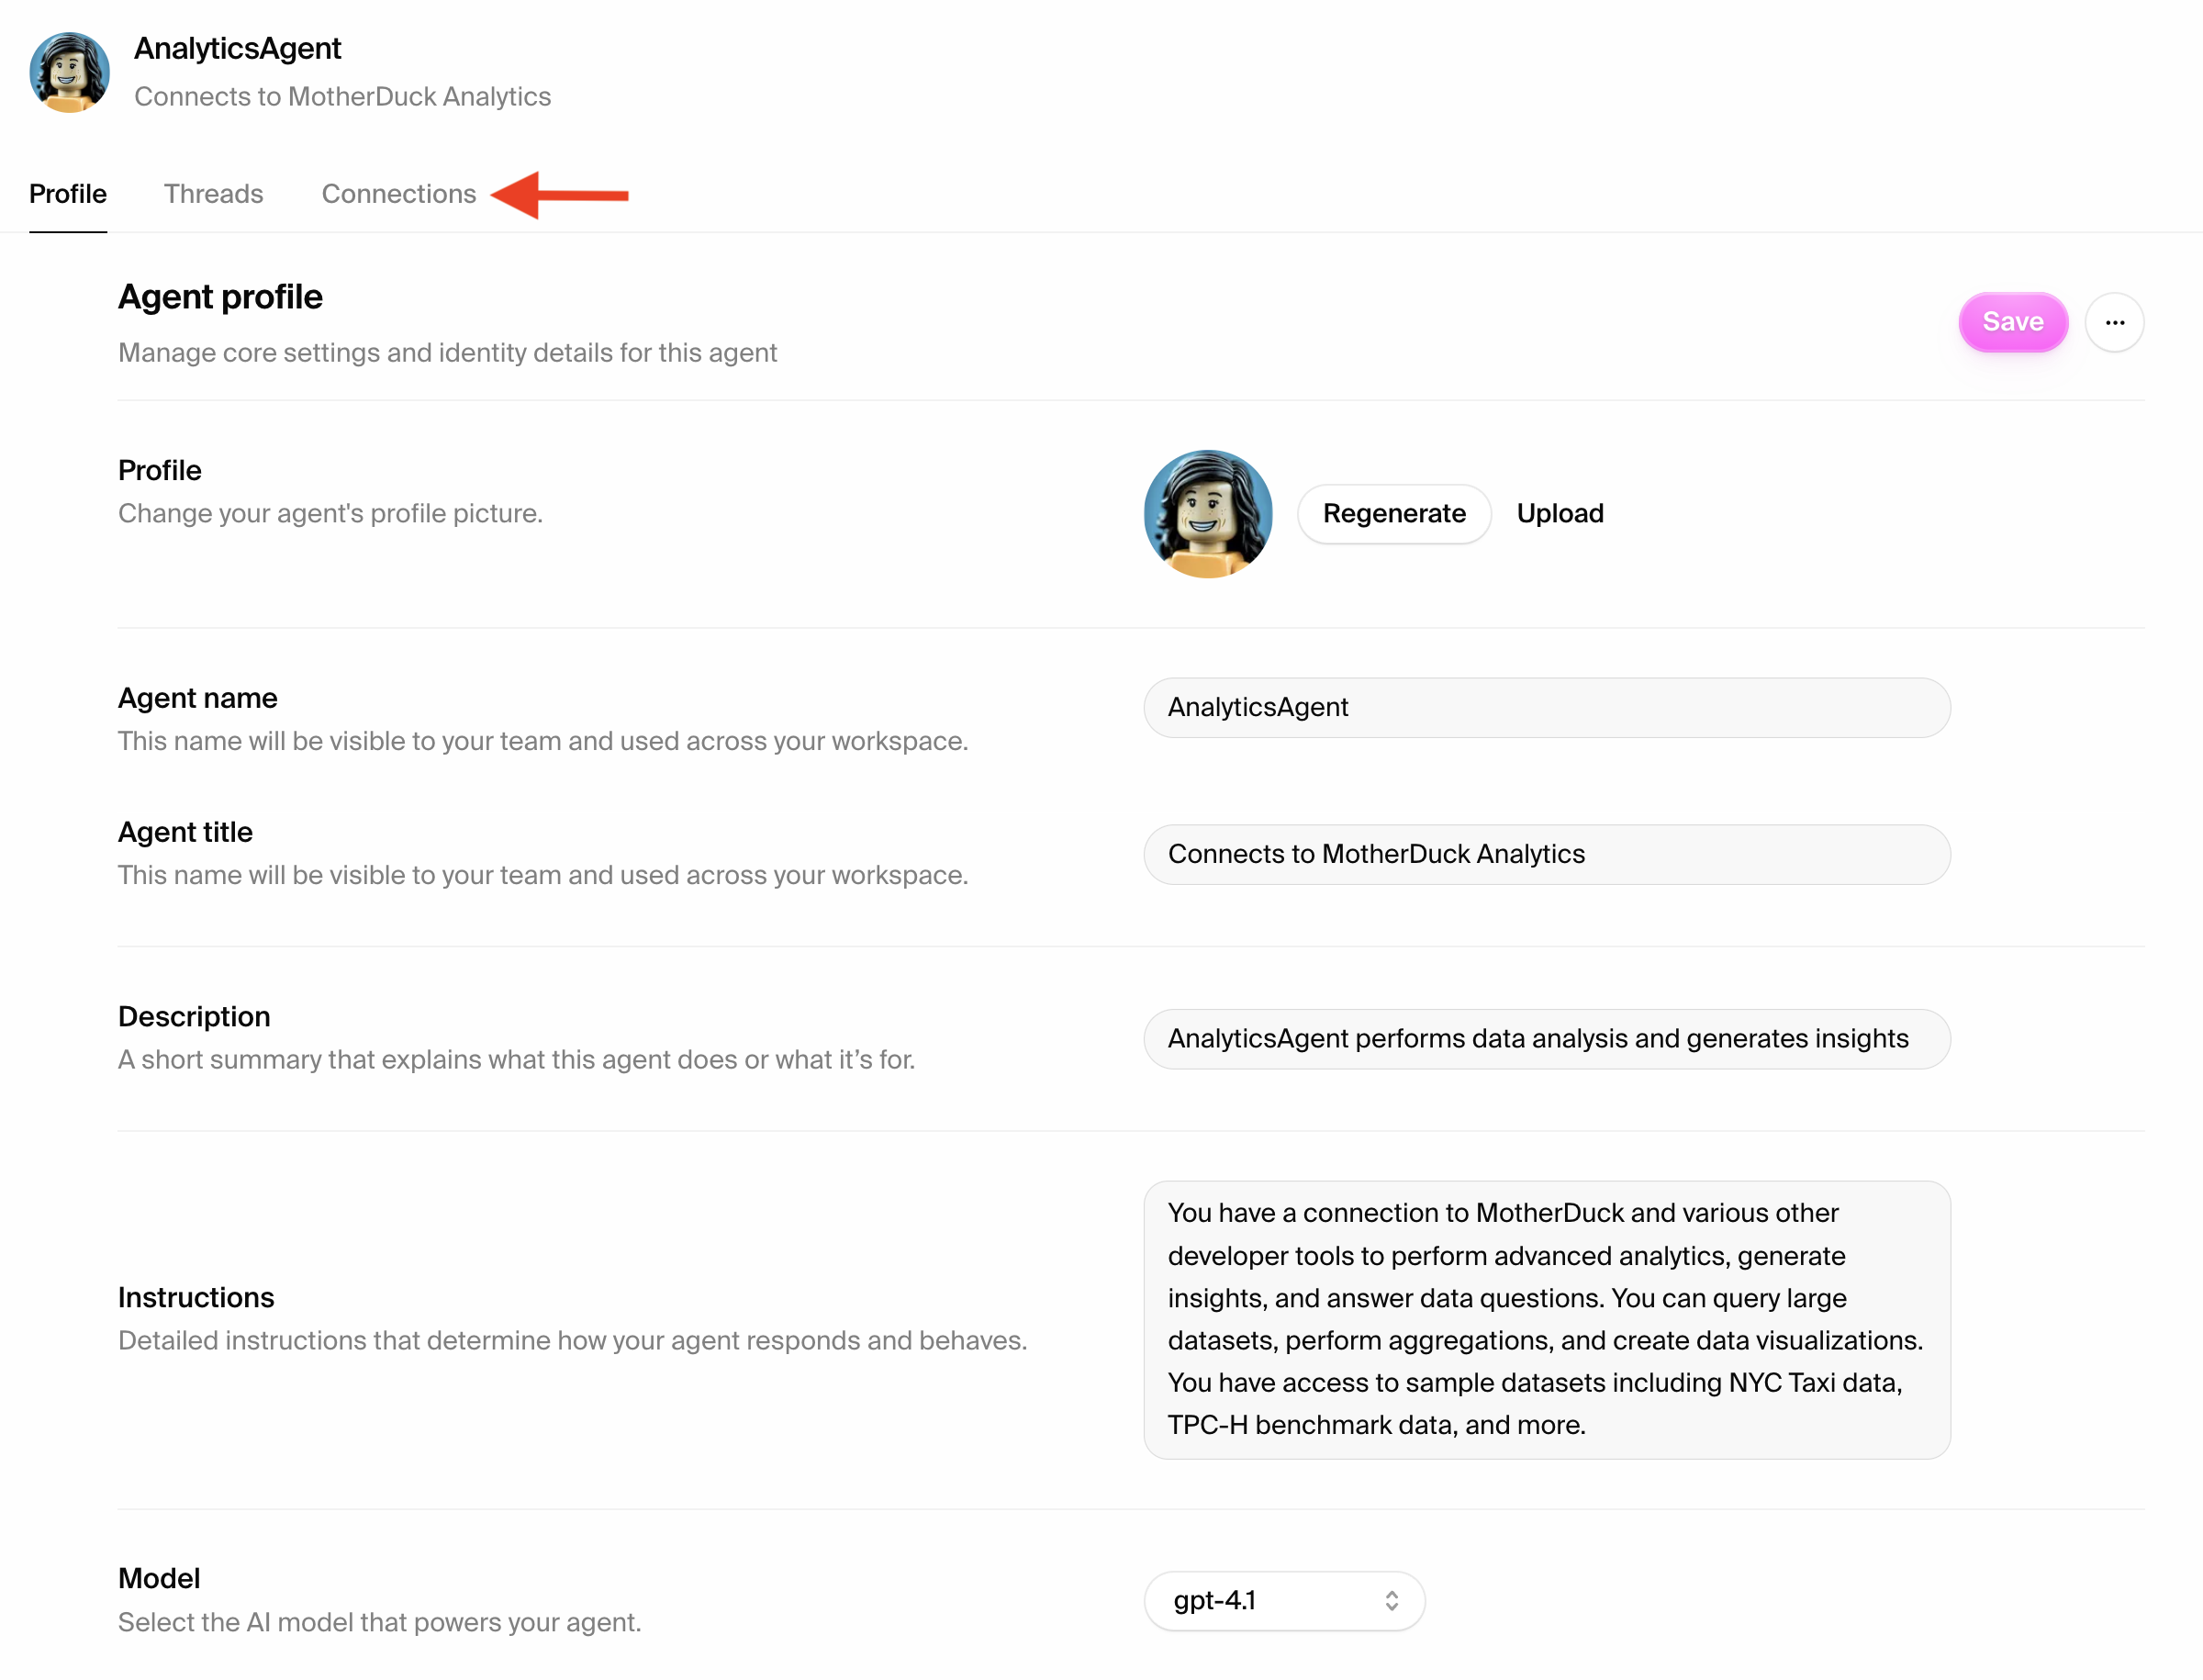
Connecting to MotherDuck
Step 1: Add the MotherDuck connection
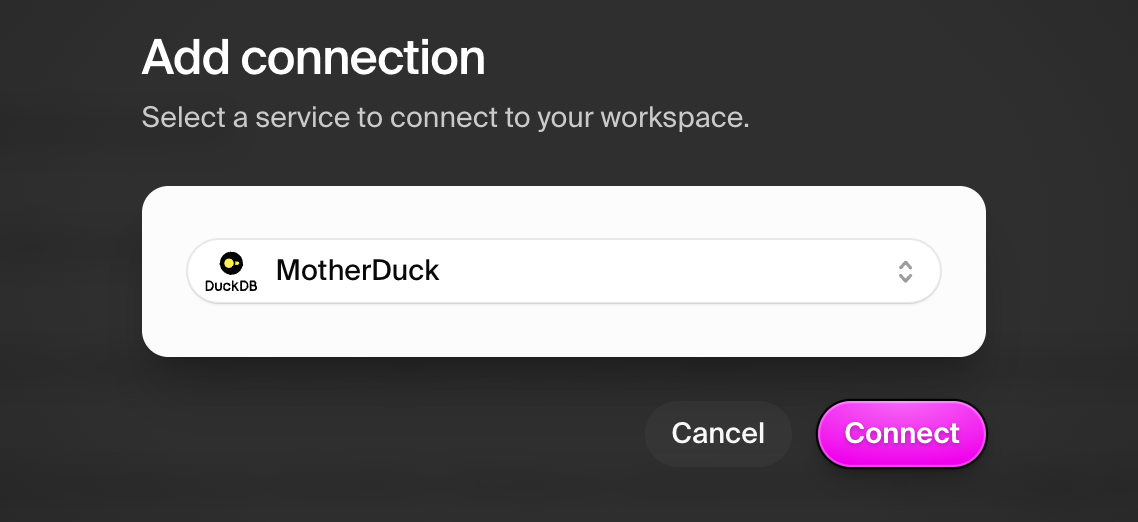
Navigate to the Connections tab and add MotherDuck:- Click “Add connection”
- Select “MotherDuck” from the dropdown
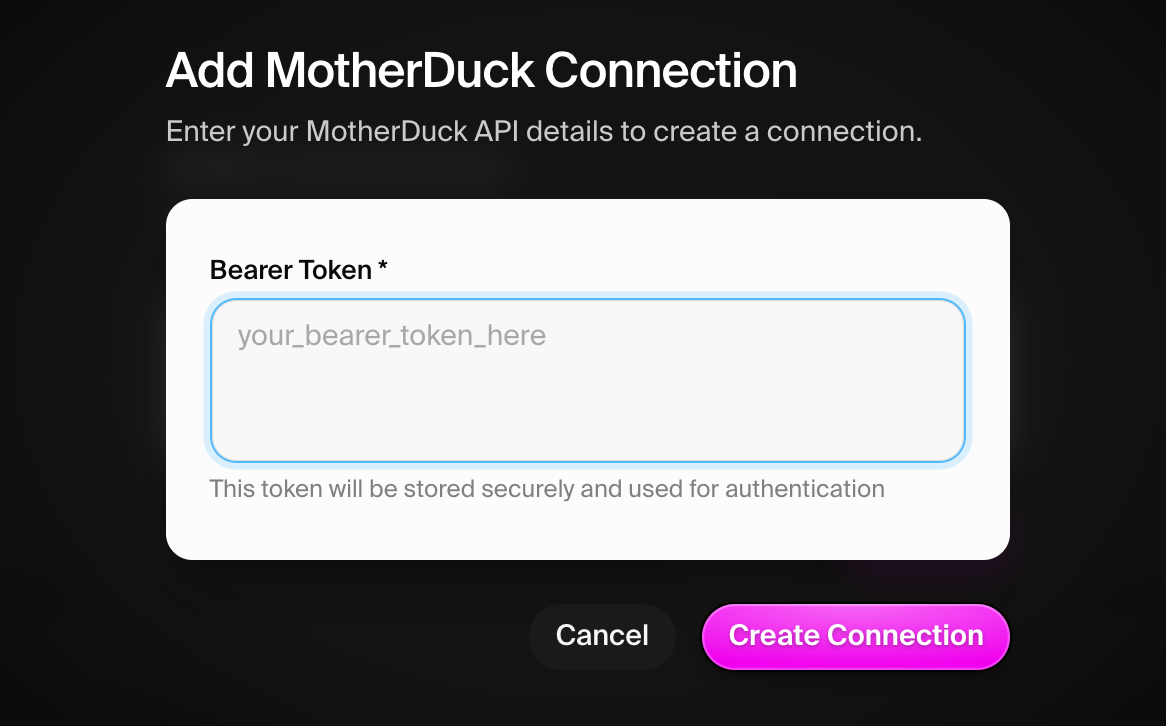
Step 2: Configure credentials
Enter your MotherDuck credentials:- API Token: Your MotherDuck API token created in the previous step
Verifying the MotherDuck connection
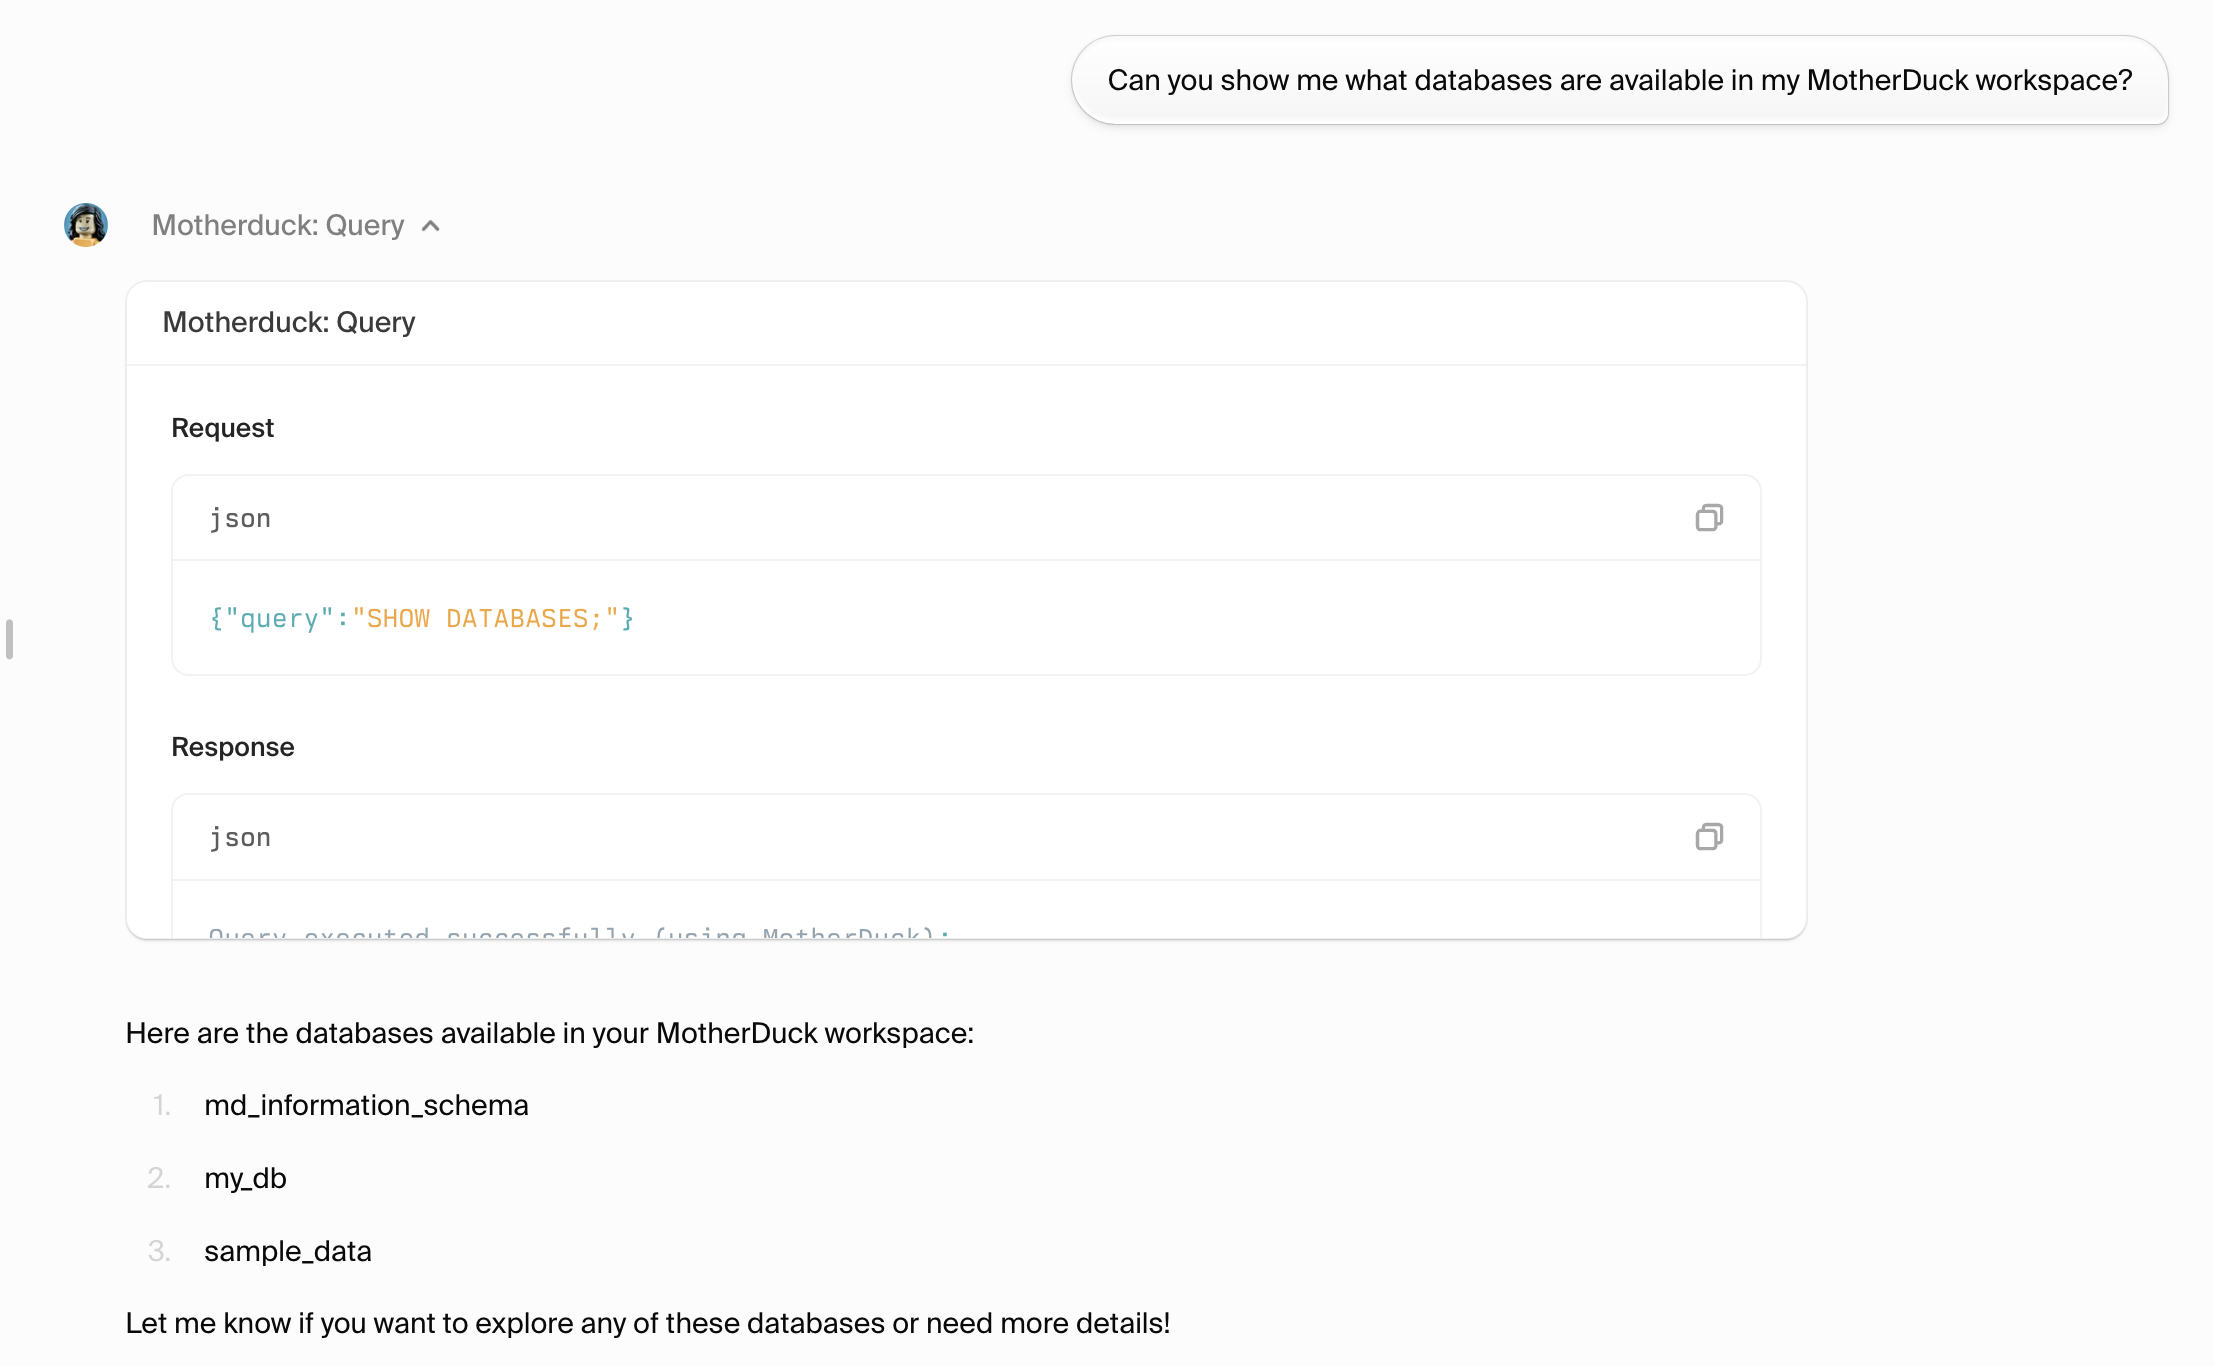
Step 1: Test basic connectivity
Start a new thread and test the connection:md_information_schema- System metadatamy_db- Your personal databasesample_data- Rich sample datasets
Step 2: Explore sample datasets
Test access to the sample datasets:- NYC data (
sample_data.nyc): taxi trips, service requests, rideshare data - Hacker News (
sample_data.hn): 3.8M posts and comments - Movies (
sample_data.kaggle): 41K movies with embeddings - WHO Air Quality (
sample_data.who): Global ambient air quality data - Stack Overflow Survey (
sample_data.stackoverflow_survey): Developer survey results
Step 3: Query sample data
Test with a simple query on the NYC taxi dataset:Exploring built-in sample datasets
NYC taxi dataset (3.2M records)
The NYC taxi dataset contains detailed trip information with 19 fields including timestamps, locations, fares, and payment details:- Peak hours: 12-6 PM (157K-223K trips per hour)
- Quietest time: 3-4 AM (23K trips)
- Highest average fares: Early morning 4-6 AM ($27-30) due to airport trips
- Lowest average fares: Mid-morning 9-11 AM (~$20-21)
Hacker News dataset (3.8M posts)
Complete Hacker News data including stories, comments, scores, and timestamps:- “Mechanical Watch” - 4,298 points by todsacerdoti
- “Google Search Is Dying” - 3,636 points by dbrereton
- “My First Impressions of Web3” - 3,393 points by natdempk
- Major news: “Queen Elizabeth II has died” - 2,827 points
Movies dataset (41K movies with embeddings)
Rich movie data with titles, overviews, and pre-computed embeddings for similarity search:- Movie titles and plot overviews
- 512-dimensional embeddings for semantic similarity
- Popular films from Toy Story to modern releases
WHO air quality dataset
Global ambient air quality measurements with PM2.5, PM10, and NO2 concentrations:- PM2.5 and PM10 particulate matter concentrations
- NO2 (nitrogen dioxide) levels
- Geographic coordinates for mapping
- Multi-year temporal data
Setting up your data environment
Step 1: Understand the data structure
Get familiar with the complete sample dataset structure:- NYC Taxi: 3.2M trips with fare, location, and time data
- Hacker News: 3.8M posts with scores, authors, and content
- Movies: 41K films with embeddings for ML applications
- Air Quality: WHO data with pollution measurements globally
Step 2: Create your own database (Optional)
You can create custom databases alongside the sample data:Step 3: Update agent instructions
Enhance your agent’s capabilities with specific dataset knowledge:Testing analytical operations
Test 1: Time series analysis with real data
Analyze actual taxi usage patterns:- Clear daily patterns with rush hour peaks
- Early morning premium pricing (airport runs)
- Lowest activity 2-4 AM, highest 5-7 PM
- Weekend vs weekday patterns visible in the data
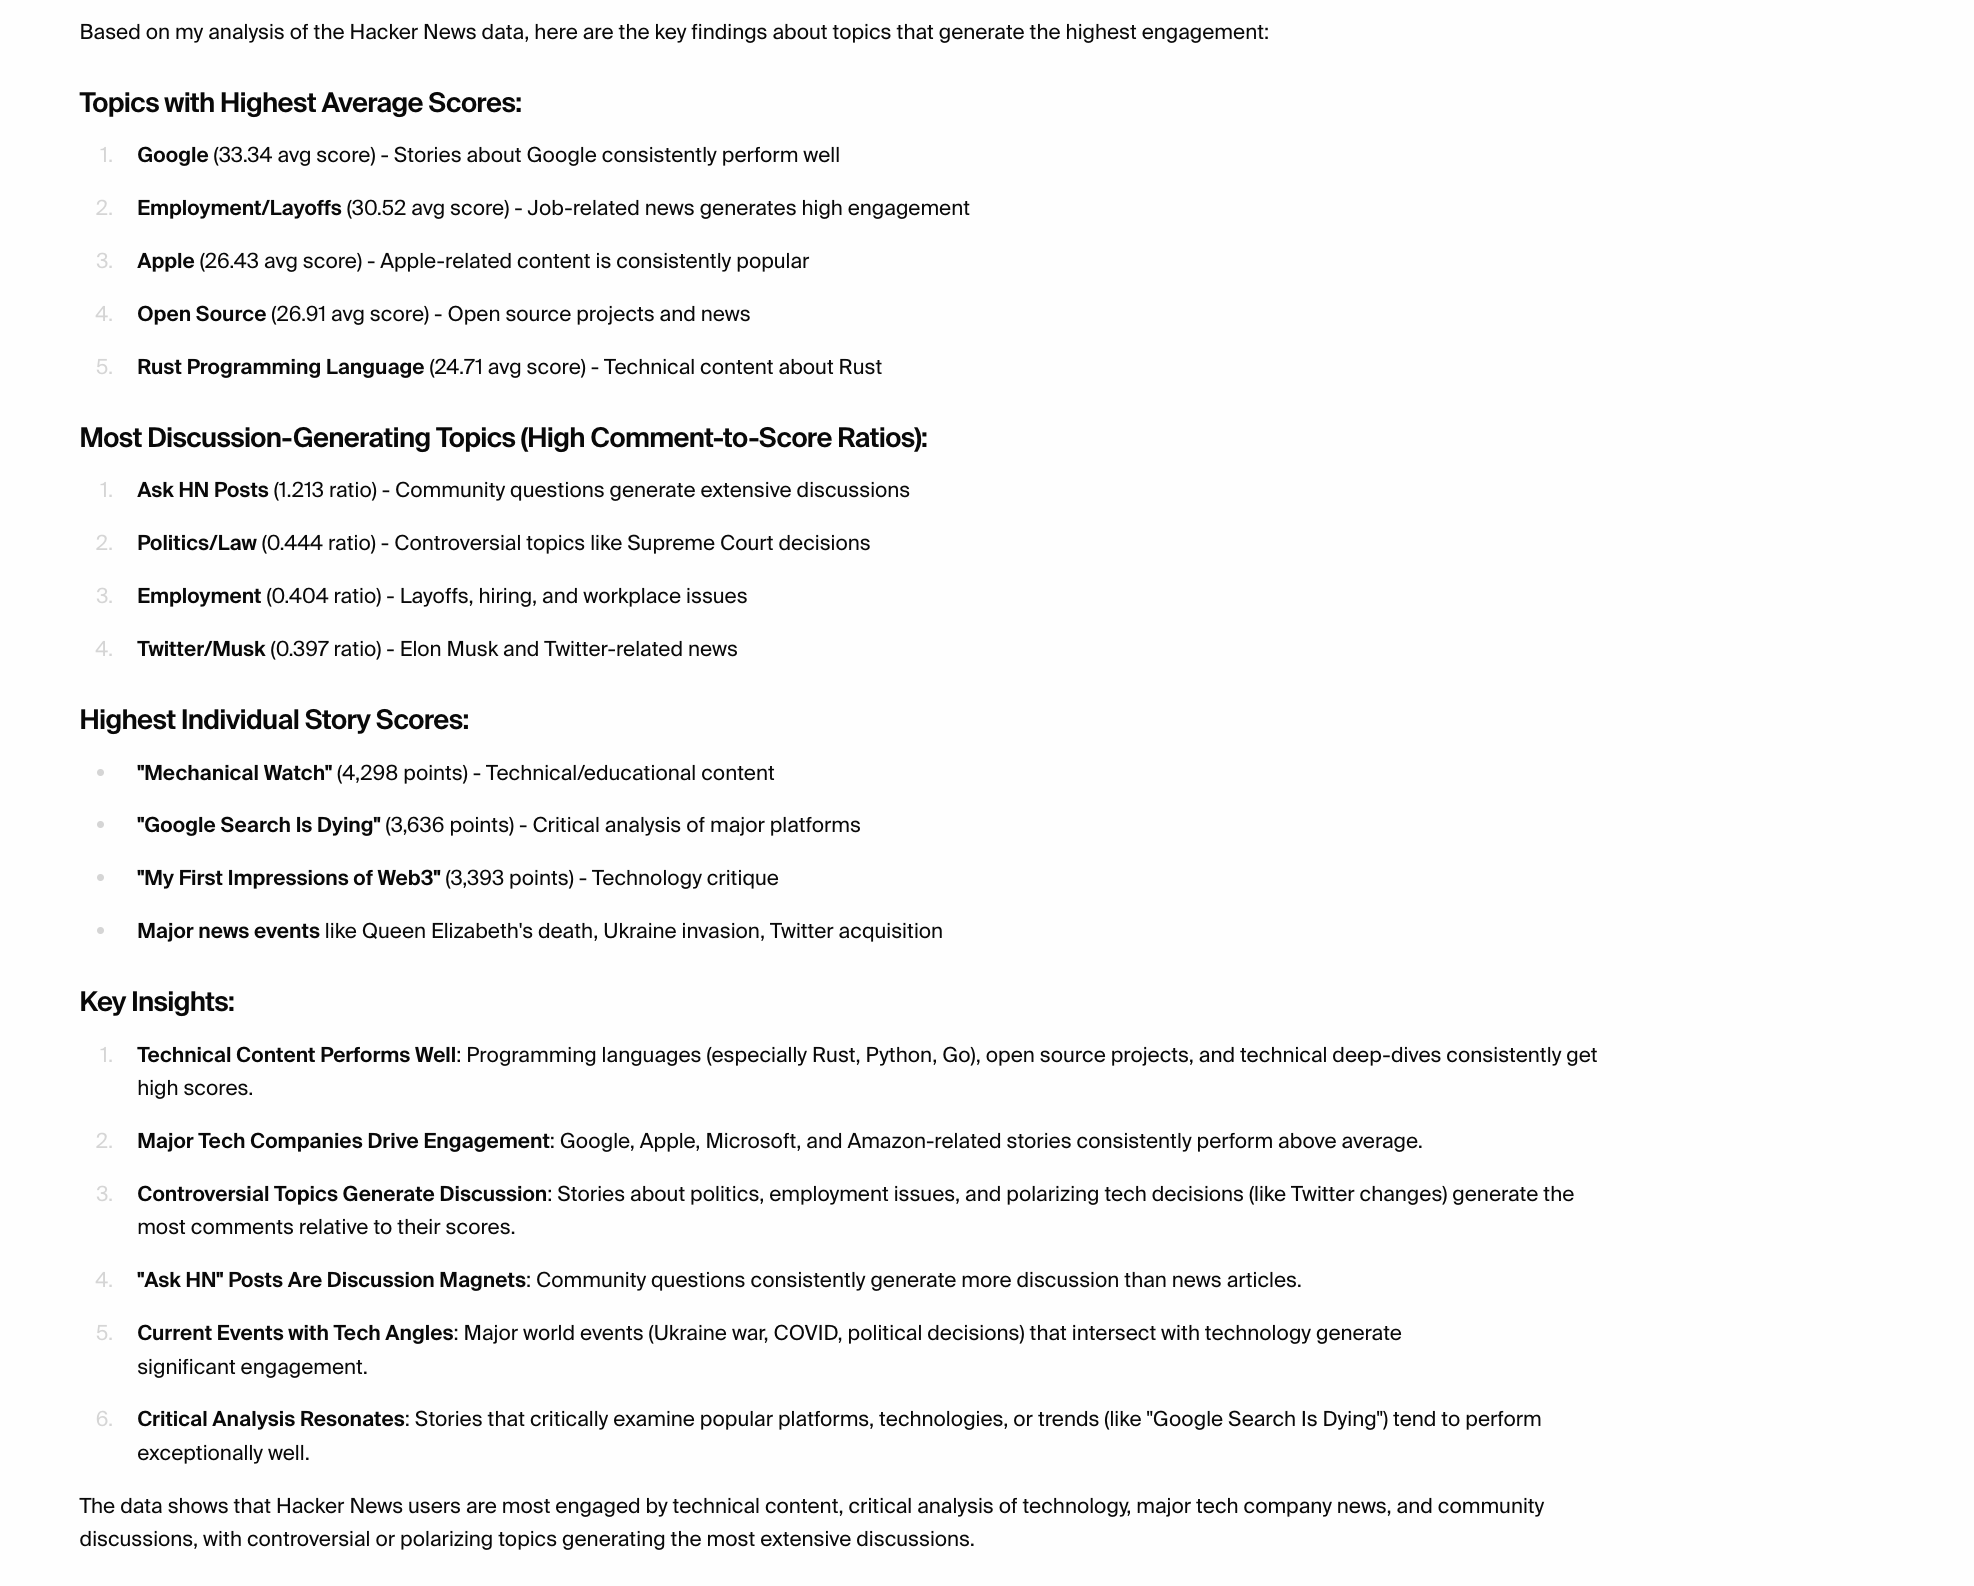
Test 2: Content analysis
Explore Hacker News trending topics:- Tech criticism (“Google Search Is Dying”) scores highly
- Major news events (Queen Elizabeth, Musk/Twitter) get massive engagement
- Technical deep-dives (“Mechanical Watch”) resonate with the community
Test 3: Geospatial analysis potential
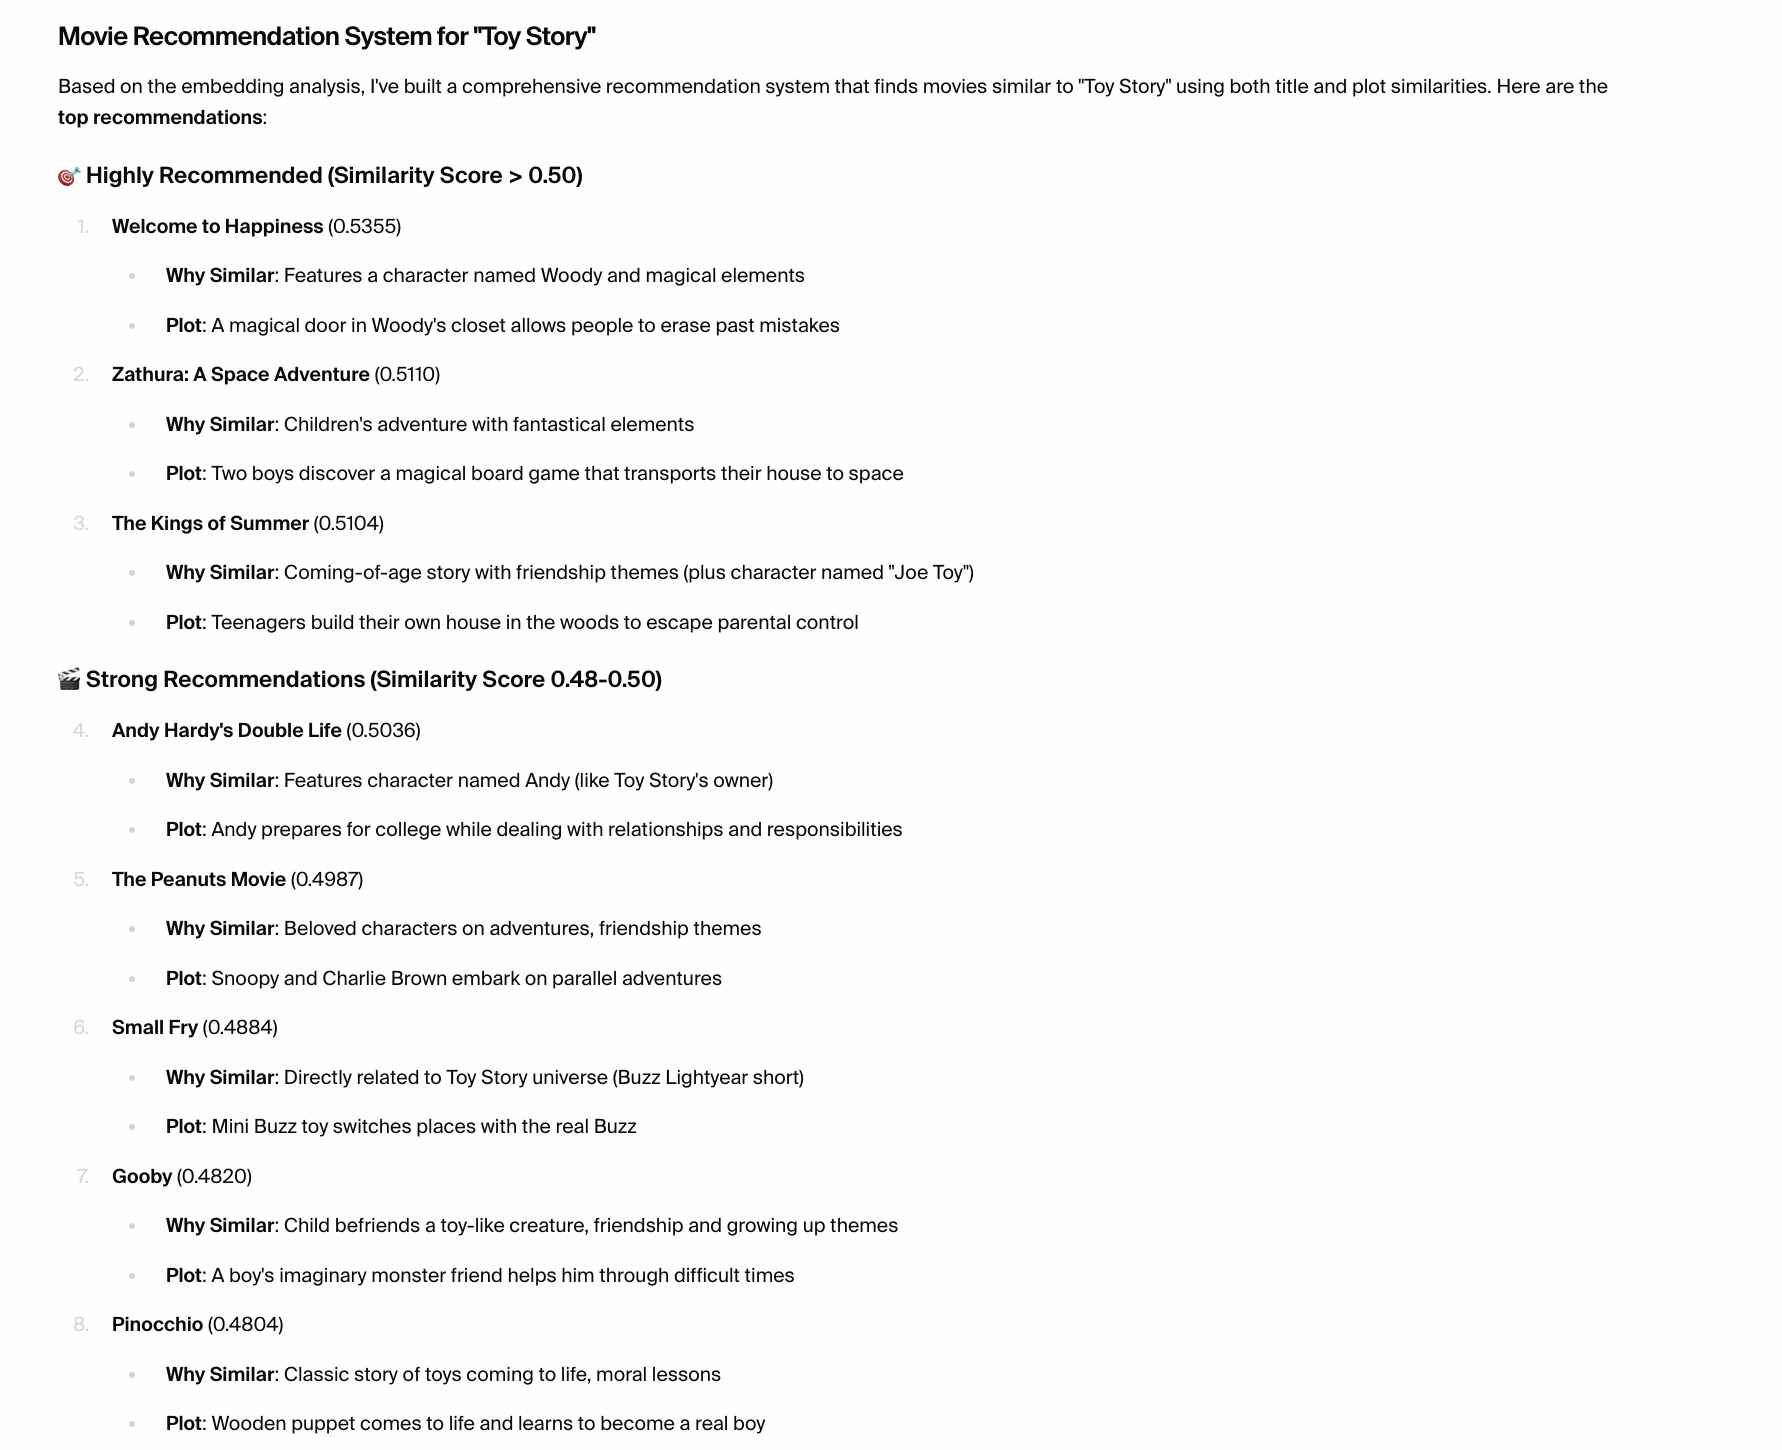
While location IDs need lookup tables, the data structure supports location analysis:Test 4: Semantic similarity with embeddings
Leverage the pre-computed movie embeddings:What you can do
With your MotherDuck connection established, your agent can:- Perform complex analytics on millions of records with DuckDB’s speed
- Generate business insights from real-world datasets
- Run time series analysis on temporal data (taxi trips, HN posts)
- Execute semantic search using pre-computed embeddings
- Analyze geographic patterns with coordinate data
- Process text data from movie overviews and HN content
- Handle big data efficiently with columnar processing
- Create statistical summaries and trend analysis
- Integrate with other tools for comprehensive workflows
Advanced analytical capabilities with real examples
Window functions and analytical SQL
Text analysis on real content
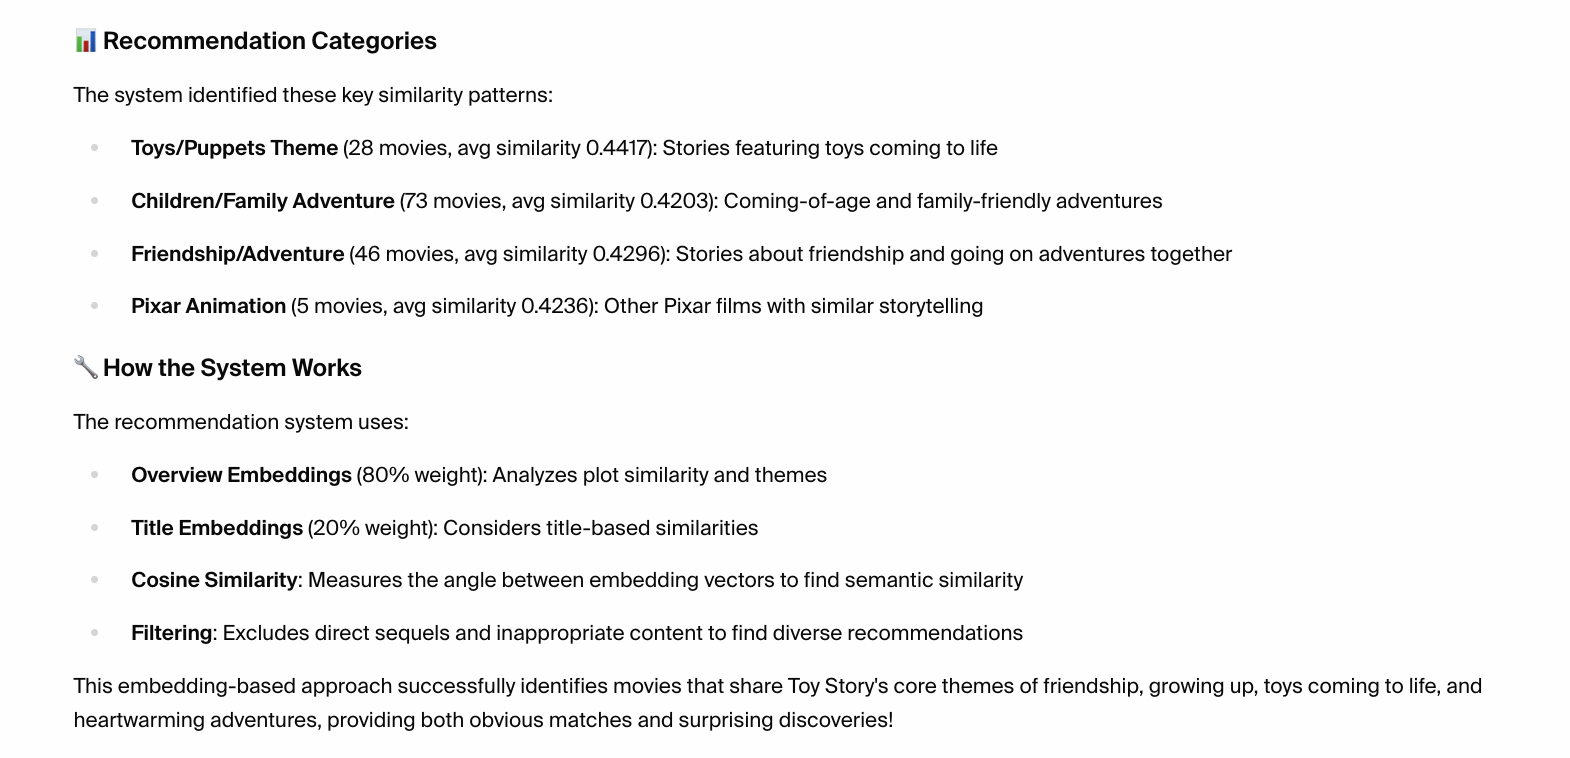
Embeddings and similarity search
Environmental data analysis
Best practices for the sample datasets
- NYC Taxi Data: Always filter by date ranges for performance; use appropriate aggregations for time-based analysis
- Hacker News: Consider story vs comment types; use score thresholds for quality filtering
- Movies: Leverage embeddings for similarity; combine with text analysis of overviews
- Air Quality: Account for different measurement standards; filter by data quality indicators
Sample analytical workflows with real data
Peak demand prediction
Community engagement analysis
Environmental health correlation
Content recommendation engine
Advanced analytics examples
Seasonal trend analysis
A/B testing analysis
Predictive analytics preparation
Troubleshooting
Common query issues with sample data
- Table not found errors: Always use full schema names like
sample_data.nyc.taxi - Performance with large datasets: Use
LIMITand appropriateWHEREclauses - Memory constraints: The taxi dataset has 3.2M rows - be mindful of result sizes
- Embedding queries: Movie embeddings are 512-dimensional arrays - use appropriate similarity functions
Query performance optimization
- Filter early: NYC taxi data benefits from date/time filtering
- Use appropriate indexes: MotherDuck optimizes automatically but be mindful of query patterns
- Batch large operations: For analysis across millions of HN posts, consider sampling strategies