Day 21 challenge
Goal: master advanced graph data modeling concepts with DgraphTheme: context engineering week - sophisticated knowledge graph architectureTime investment: ~25 minutes
What you’ll accomplish today
- Understand key Dgraph concepts and architecture
- Load sample RDF data from a news article knowledge graph
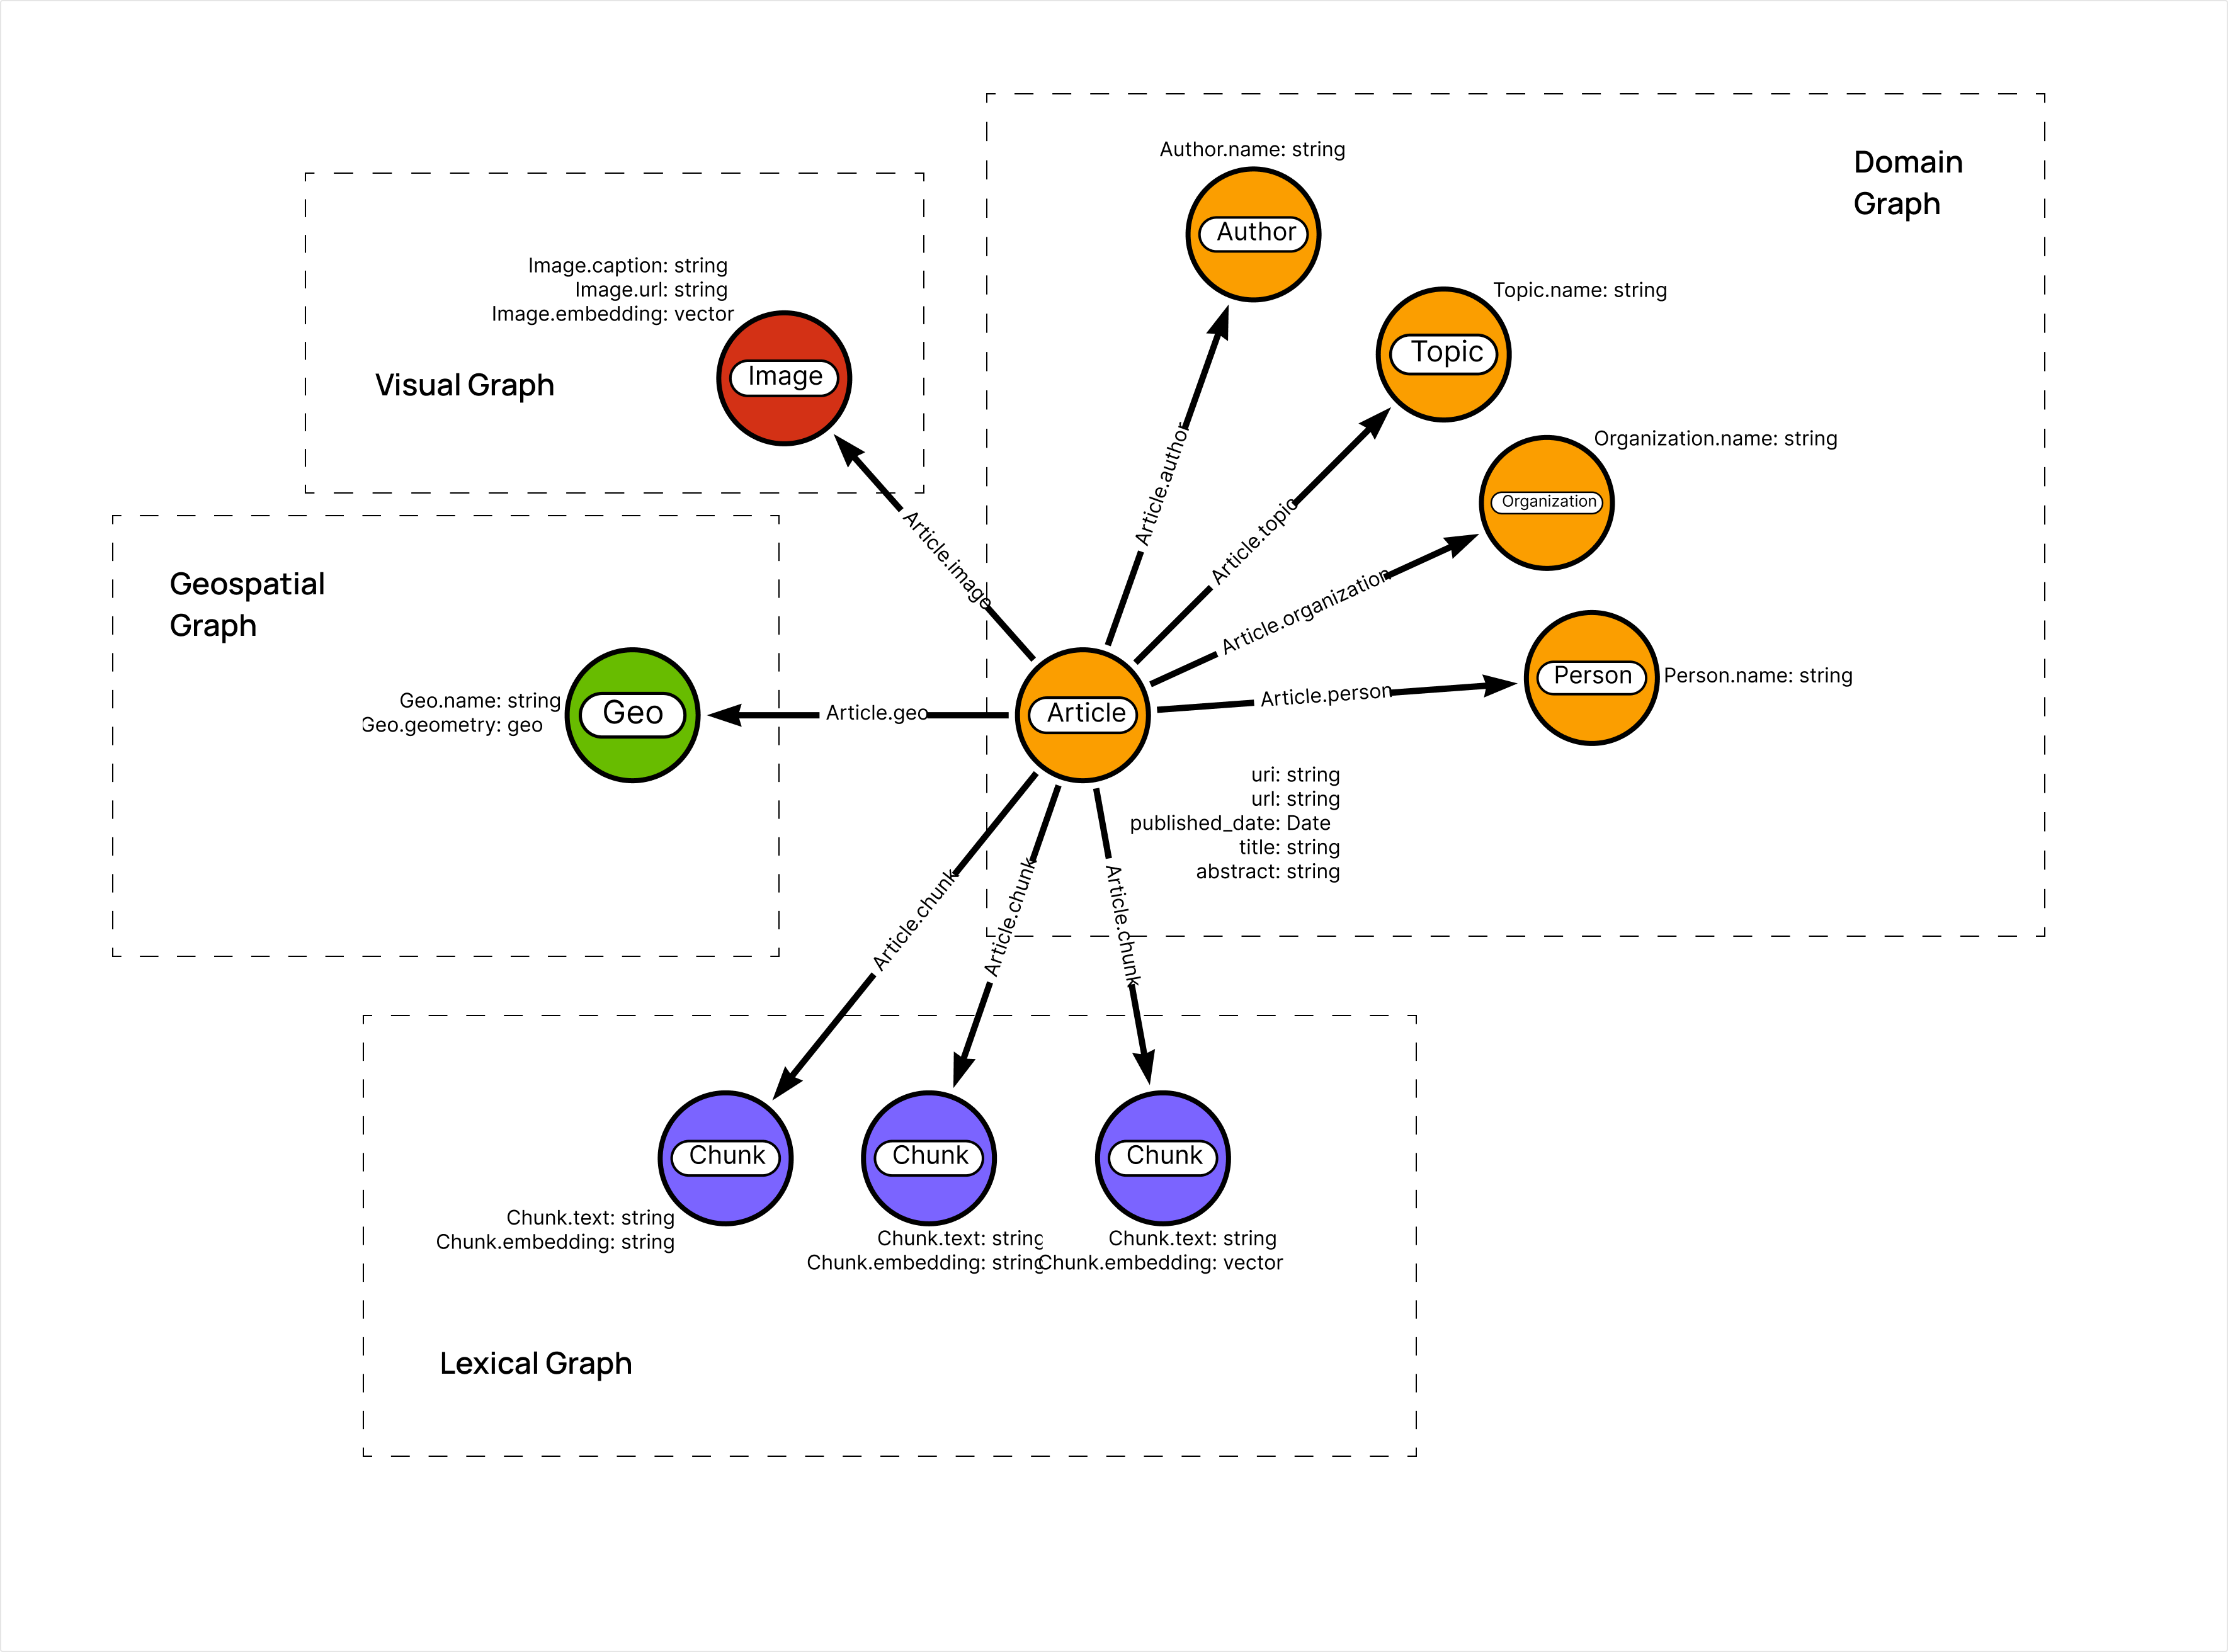
- Explore different types of knowledge graphs (lexical, domain, visual, geospatial)
- Model complex relationships and schema design
- Connect to the hyper-news example project for real-world data
This introduces advanced graph database concepts. You’ll work with RDF data
formats and sophisticated schema design patterns that differ from traditional
databases.
Understanding key Dgraph concepts
Dgraph differs from other graph databases in several important ways:Dgraph architecture
Dgraph makes- Distributed by design: Automatically shards data across multiple nodes
- ACID transactions: Full transactional consistency across the distributed system
- GraphQL native: Direct GraphQL support without translation layers
- Type system: Strong typing with schema validation
Core concepts
- Predicates: Properties or relationships between nodes (similar to edges)
- UIDs: Unique identifiers for nodes (automatically managed)
- Facets: Properties on predicates (metadata about relationships)
- Types: Schema definitions that group predicates
- Indexes: Optimizations for specific query patterns
Graph data modeling
Step 1: Create your Hypermode Graph instance
We’ll use the hyper-news project as our example - a news article knowledge graph that demonstrates real-world complexity using data from the New York Times API.Project structure
The hyper-news knowledge graph contains:- Articles: News articles with content, metadata, and relationships
- Entities: People, organizations, locations mentioned in articles
- Topics: Subject categories and themes
- Sources: News outlets and publishers
- Temporal data: Publication dates and time-based relationships
Create your Hypermode graph
1
Sign in to Hypermode
Navigate to Hypermode and sign in.
2
Create a new graph
Select the “Develop” tab and click “Create Graph”. Give your graph a name and
select “Create Graph”.
3
Copy the Dgraph connection string
Copy the 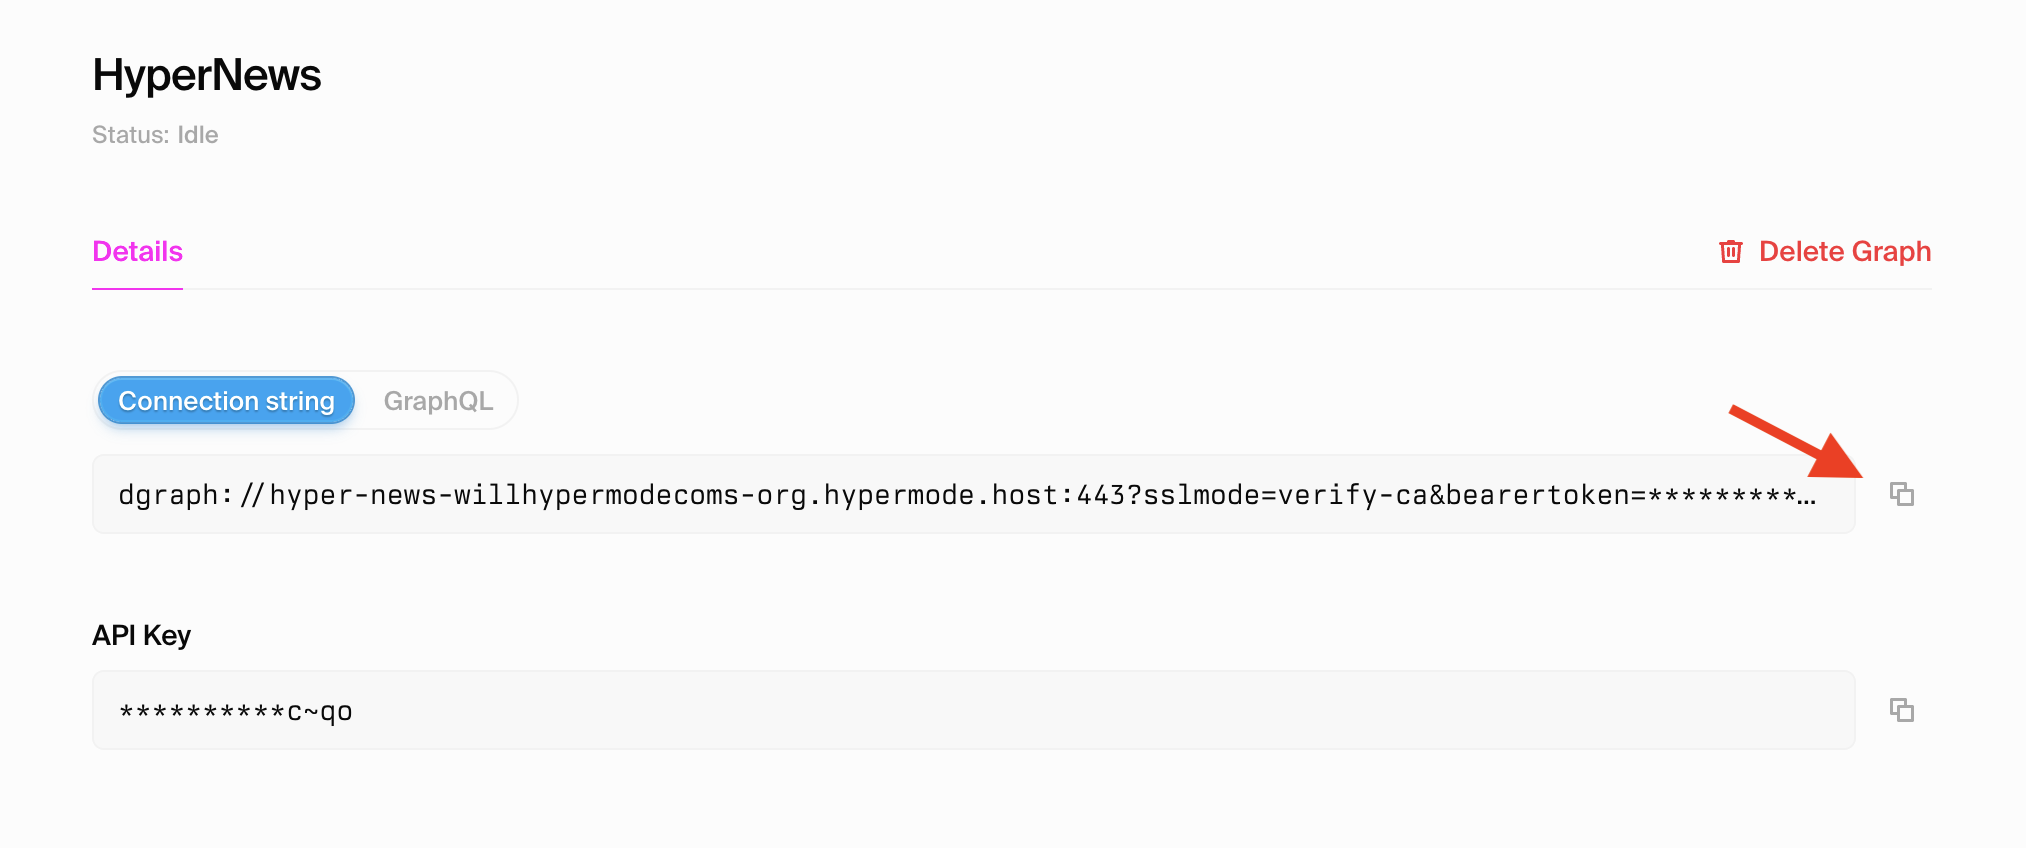
dgraph:// connection string, you’ll use this to connect to your
Hypermode Graph instance.4
Open the Ratel interface
Navigate to ratel.hypermode.com and connect to
your Hypermode Graph instance using the 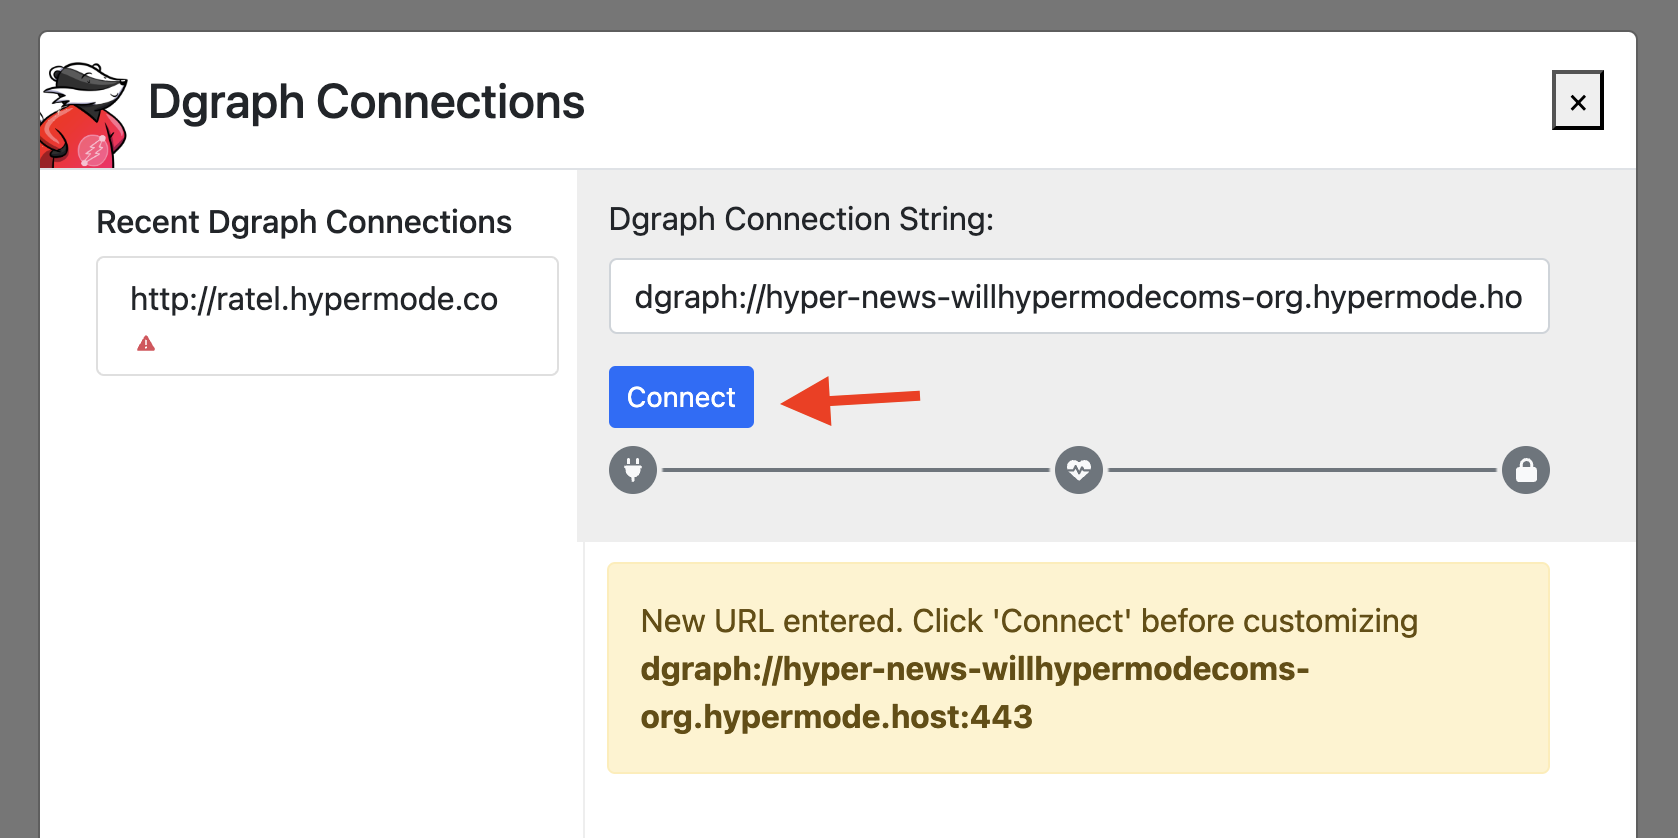
dgraph:// connection string5
Update the graph schema
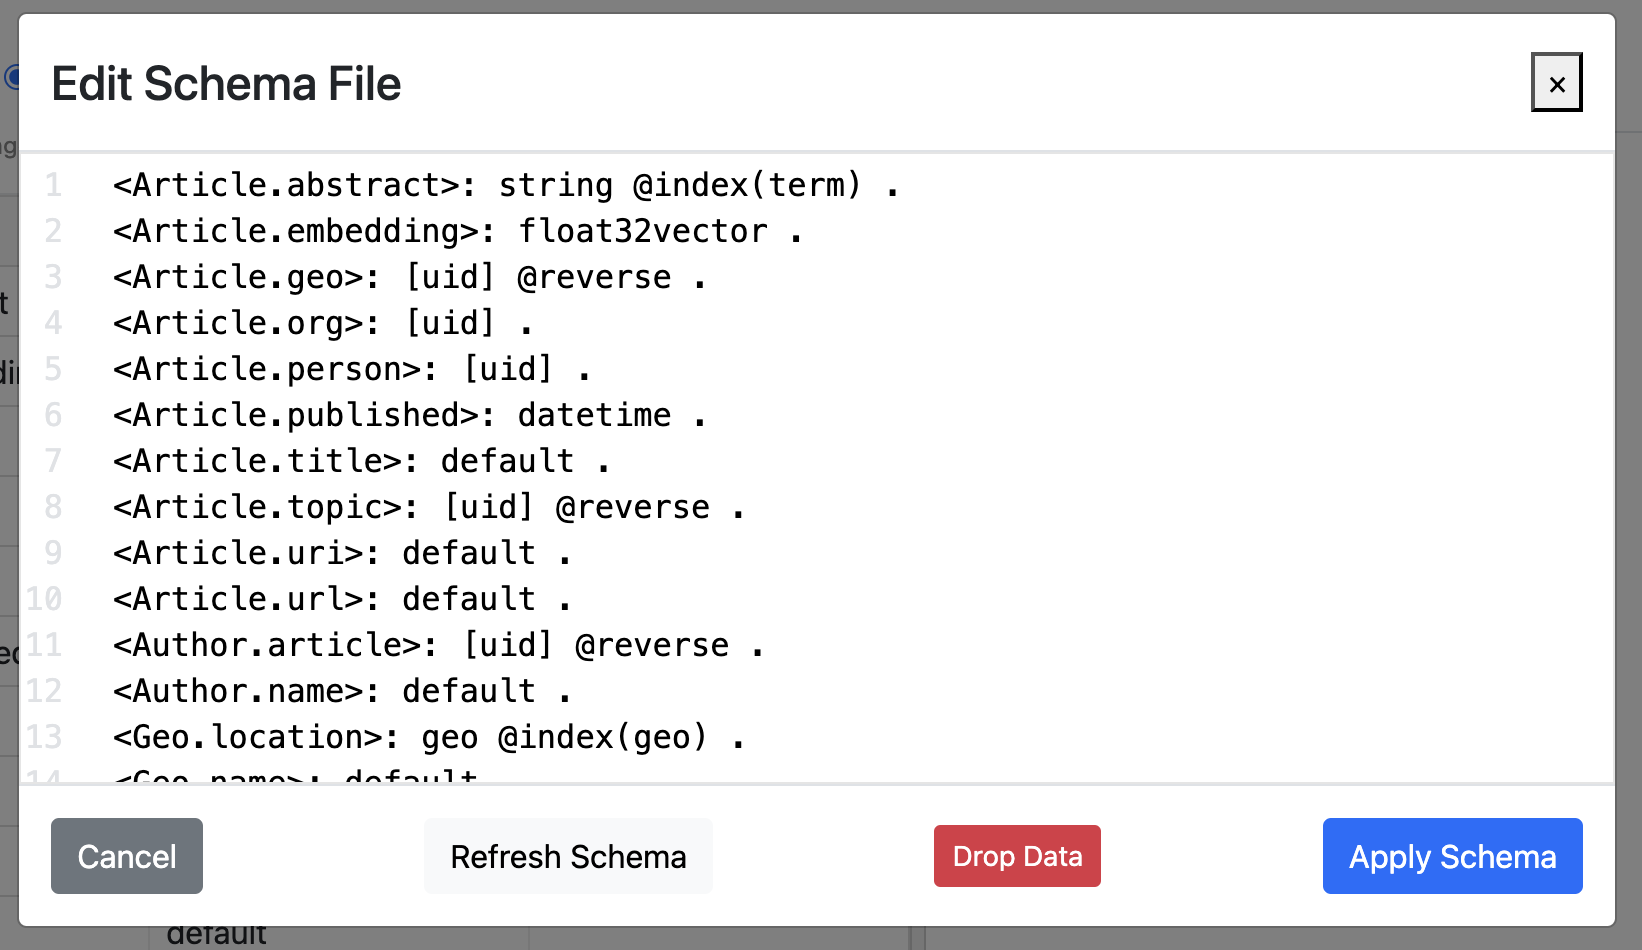
Copy this DQL schema to update your graph schema
Copy this DQL schema to update your graph schema
Copy
Ask AI
<Article.abstract>: string @index(term) .
<Article.embedding>: float32vector @index(hnsw(metric:"euclidean")) .
<Article.geo>: [uid] @reverse .
<Article.org>: [uid] .
<Article.person>: [uid] .
<Article.published>: datetime .
<Article.title>: default .
<Article.topic>: [uid] @reverse .
<Article.uri>: default .
<Article.url>: default .
<Author.article>: [uid] @reverse .
<Author.name>: default .
<Geo.location>: geo @index(geo) .
<Geo.name>: default .
<Image.article>: [uid] .
<Image.caption>: default .
<Image.url>: default .
<Organization.name>: default .
<Person.name>: default .
<Topic.name>: string @index(fulltext) .
<dgraph.drop.op>: string .
<dgraph.graphql.p_query>: string @index(sha256) .
<dgraph.graphql.schema>: string .
<dgraph.graphql.xid>: string @index(exact) @upsert .
type <dgraph.graphql> {
  dgraph.graphql.schema
  dgraph.graphql.xid
}
type <dgraph.graphql.persisted_query> {
  dgraph.graphql.p_query
}
6
Import the sample data into your graph
Load RDF data into your graph, navigate to the
Ratel interface and connect to your graph using
the Dgraph connection string. Then run the following mutation in Ratel (be sure
to select the Mutate tab):
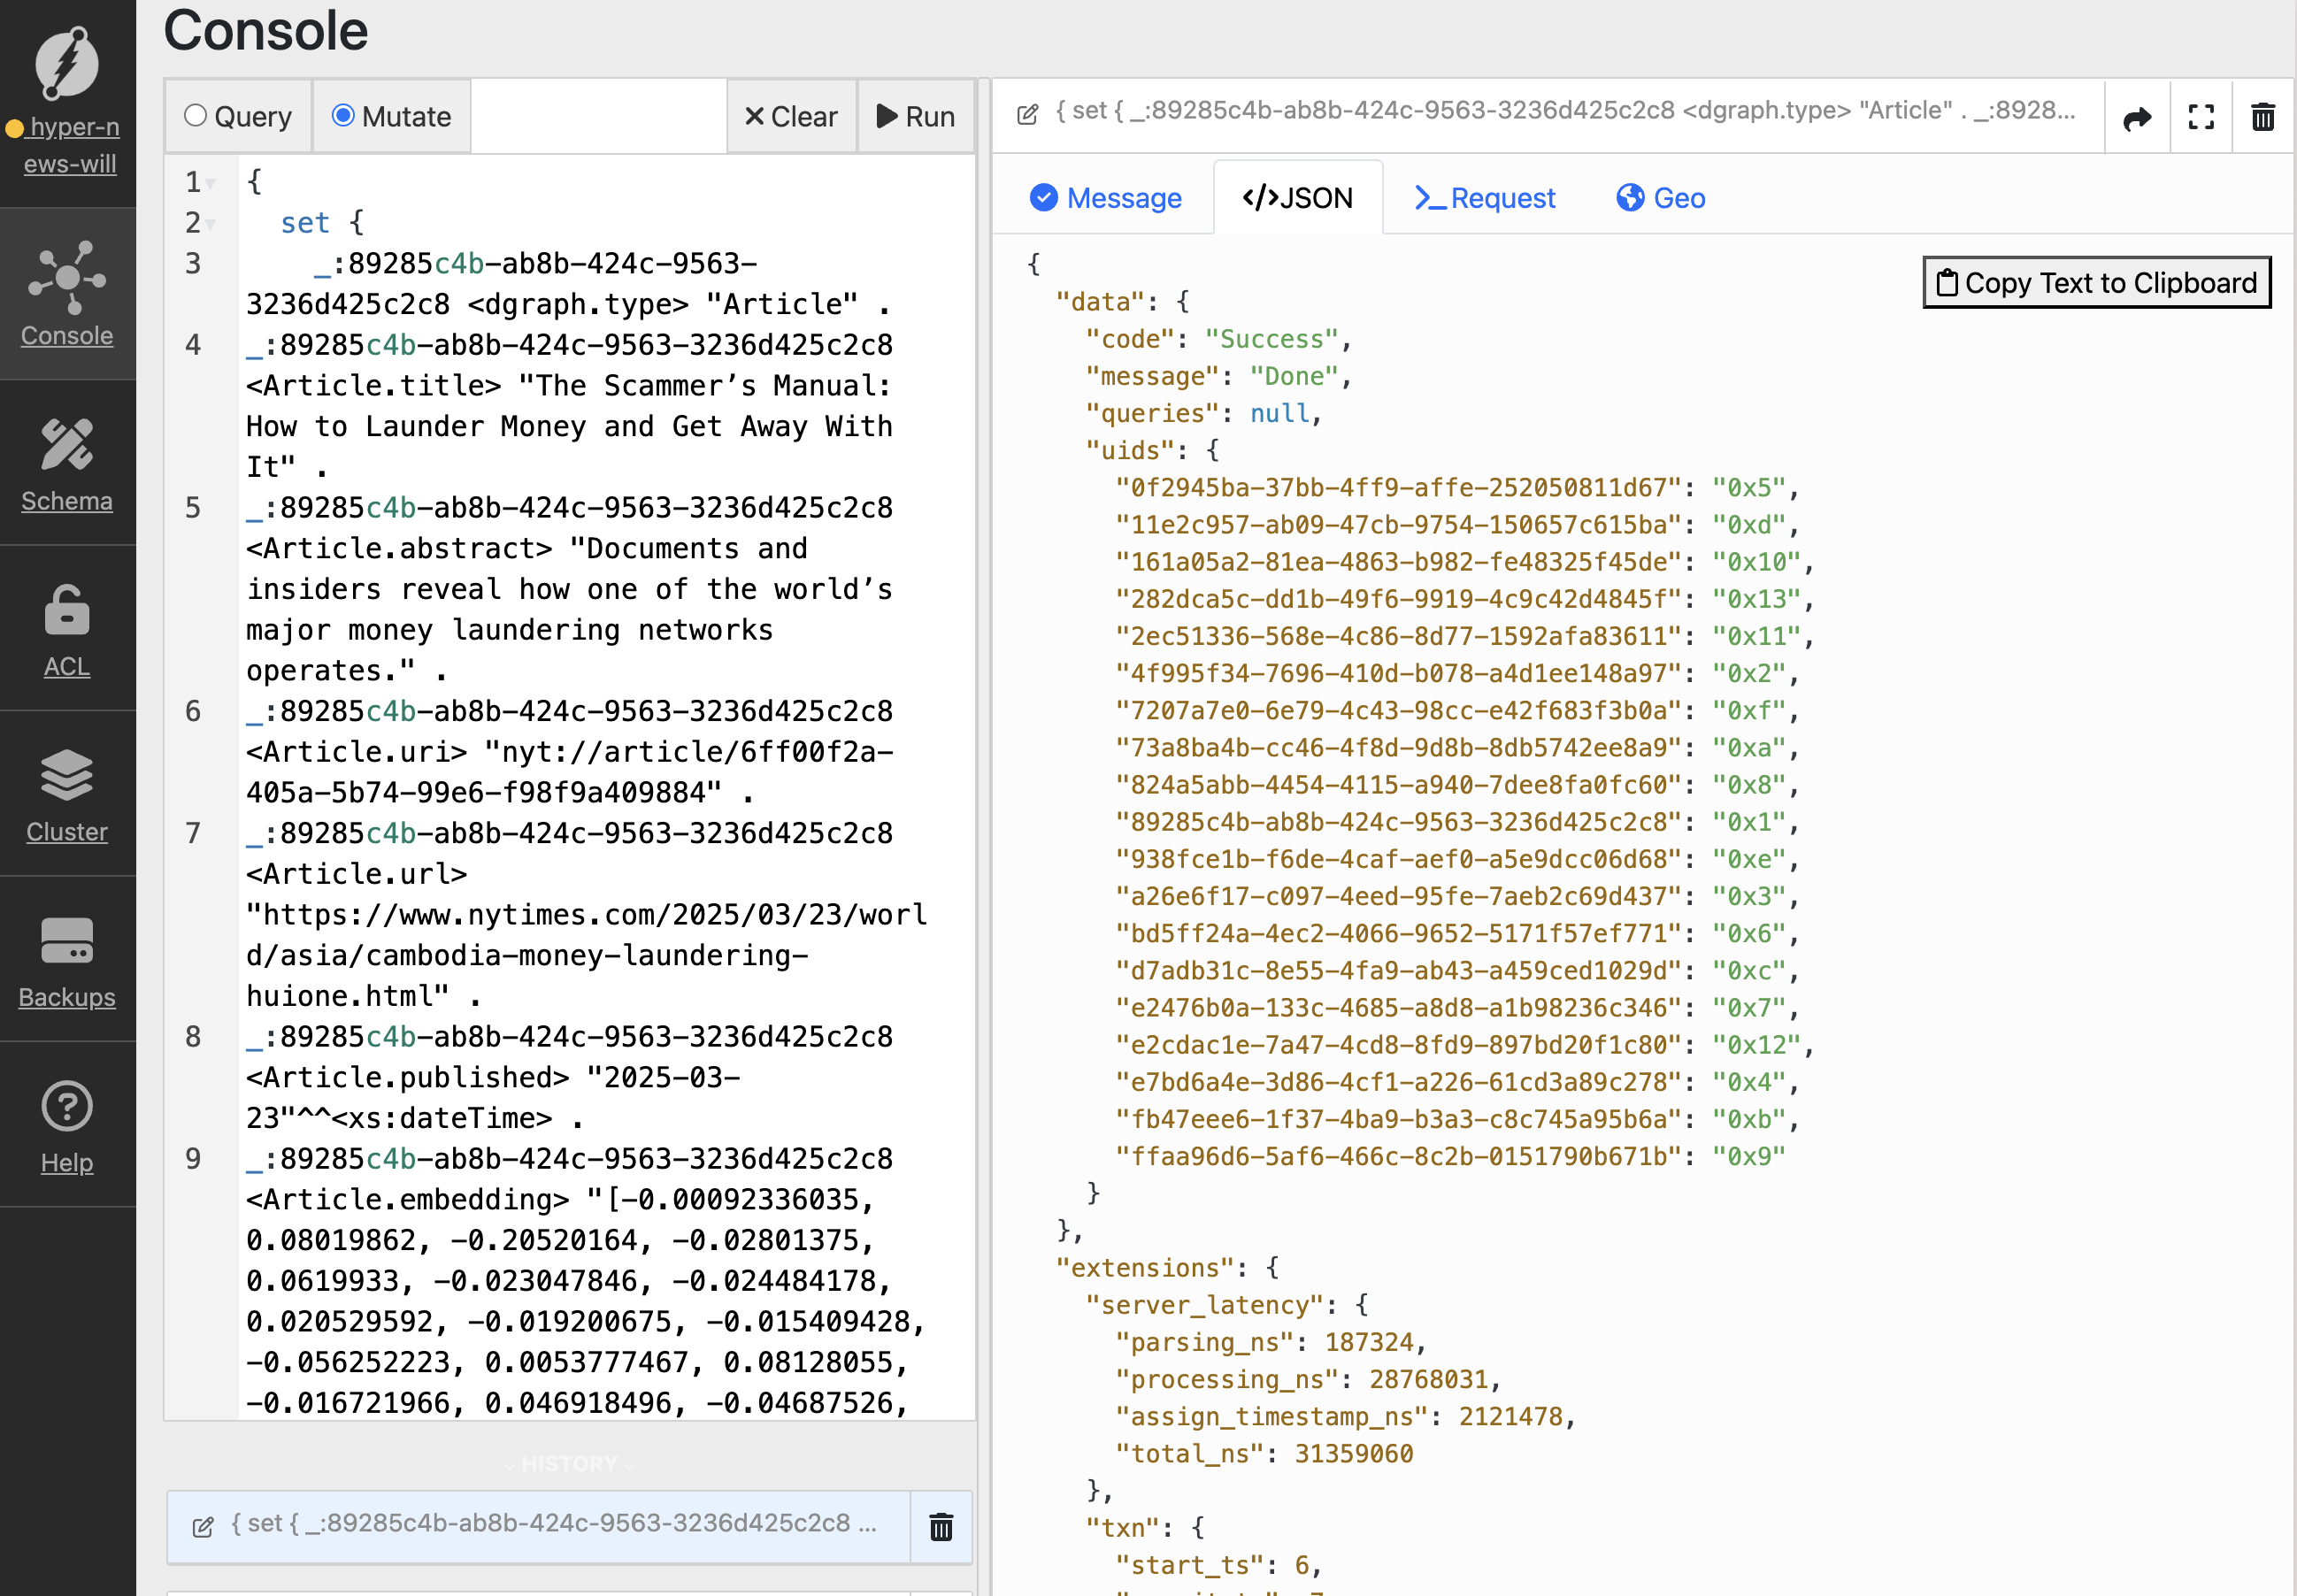
Copy this DQL mutation to load sample data
Copy this DQL mutation to load sample data
Copy
Ask AI
{
  set {
    _:89285c4b-ab8b-424c-9563-3236d425c2c8 <dgraph.type> "Article" .
_:89285c4b-ab8b-424c-9563-3236d425c2c8 <Article.title> "The Scammer's Manual: How to Launder Money and Get Away With It" .
_:89285c4b-ab8b-424c-9563-3236d425c2c8 <Article.abstract> "Documents and insiders reveal how one of the world's major money laundering networks operates." .
_:89285c4b-ab8b-424c-9563-3236d425c2c8 <Article.uri> "nyt://article/6ff00f2a-405a-5b74-99e6-f98f9a409884" .
_:89285c4b-ab8b-424c-9563-3236d425c2c8 <Article.url> "https://www.nytimes.com/2025/03/23/world/asia/cambodia-money-laundering-huione.html" .
_:89285c4b-ab8b-424c-9563-3236d425c2c8 <Article.published> "2025-03-23"^^<xs:dateTime> .
_:89285c4b-ab8b-424c-9563-3236d425c2c8 <Article.embedding> "[-0.00092336035, 0.08019862, -0.20520164, -0.02801375, 0.0619933, -0.023047846, -0.024484178, 0.020529592, -0.019200675, -0.015409428, -0.056252223, 0.0053777467, 0.08128055, -0.016721966, 0.046918496, -0.04687526, -0.04218578, -0.028148863, -0.042824, 0.020917423, -0.054316618, -0.032370504, -0.028675629, 0.03997199, 0.08500988, 0.017144531, -0.024979042, -0.067222975, 0.004198151, -0.06910834, 0.02121037, -0.078714, -0.053253673, -0.021370014, -0.07213128, -0.02874543, 0.055938214, 0.034668747, -0.02257444, 0.015734173, 0.002615116, 0.037297964, -0.067191556, -0.07372232, 0.0028610034, -0.007968908, 0.0040147076, -0.01675361, 0.04276194, -0.07062117, -0.013656893, 0.069650106, 0.028920174, 0.044660687, 0.031548288, -0.037835848, -0.0064255716, 0.028911343, 0.0009169275, -0.075062, 0.087536186, 0.036825977, -0.007732731, 0.042635478, 0.024788087, -0.038203984, -0.023310525, 0.021034213, 0.00862608, -0.028094534, 0.038340803, -0.007804469, 0.019761235, -0.00019656407, 0.009244875, -0.0032964468, -0.008558698, 0.0132178115, 0.008608392, 0.064217165, 0.046111107, 0.041003242, 0.04581497, 0.020273658, 0.031235896, 0.037693854, -0.013772649, -0.057372384, -0.029200299, 0.053801484, 0.05163047, 0.0047667134, 0.037192836, 0.00623493, -0.02796813, 0.007358853, -0.035745107, 0.01275867, -0.068552606, 0.018099979, -0.020371858, -0.0604366, 0.02112771, 0.021530883, 0.0660968, 0.04888558, 0.009426717, -0.010862091, -0.002711214, 0.013900116, -0.0012326023, 0.020527879, -0.014266488, 0.03844581, 0.008625611, -0.01873364, 0.066690415, 0.0015498915, 0.009729749, 0.058517713, -0.017636323, -0.053251754, -0.023646954, 0.035909656, 0.069451794, 0.016912527, -0.02761872, 0.0029756494, 0.014486133, -0.012998973, 0.02205689, 0.0031078763, -0.010682541, -0.028948735, 0.04719423, 0.077531666, -0.03247138, -0.020979341, -0.031888198, 0.041427974, 0.030766841, 0.002485652, -0.011419673, -0.00673966, -0.023038143, -0.05797337, 0.04556867, 0.0015720715, -0.031727538, -0.018073529, -0.016680855, 0.037625983, -0.04260436, -0.010235528, -0.015568282, -0.030205876, 0.012808569, -0.03778036, 0.042217124, 0.058812555, 0.025896199, -0.017201565, -0.021295544, 0.049216032, -0.035258055, -0.03243178, 0.014102597, 0.0703021, 0.020382358, 0.024729572, -0.021165065, -0.01659005, -0.064313434, 0.010731041, 0.035184678, 0.0056777354, 0.020912189, -0.02150295, 0.07346336, -0.035706487, 0.023945468, -0.026387697, 0.03752386, 0.011889463, 0.0053924406, 0.009470379, 0.0002595008, -0.058607556, 0.032467753, -0.0790825, -0.025970004, 0.031038005, -0.014906579, -0.018815886, -0.009827676, -0.0027572436, 0.013217778, 0.005055923, 0.06915567, -0.06889581, -0.041622456, -0.015985116, -0.041358333, 0.023209602, 0.016503107, 0.026923068, -0.00042518275, 0.032977626, -0.0072815083, 0.04653621, 0.080644496, -0.03536173, 0.010074264, -0.0069507305, 0.0271821, 0.0039338847, -0.00079465157, 0.0052043544, -0.009887138, -0.0049203816, -0.0019415795, 0.011910781, 0.071534336, -0.0052370583, 0.02462654, -0.0096801305, -0.06351153, -0.057395328, -0.024206541, 0.012500014, -0.040890157, -0.090973295, 0.027518911, 0.049901217, -0.026148353, -0.011612191, 0.0130564375, 0.043747183, -0.015552951, 0.043537293, -0.013374157, 0.0017572222, -0.0826361, -0.045705117, -0.04189465, 0.015048251, -0.01184995, -0.04249196, -0.011480411, 0.032527987, 0.023902439, -0.028324336, 0.04576082, 0.010670752, 0.015860224, -0.049910758, -0.029140323, 0.03384373, 0.014318717, 0.017532011, 0.016961541, -0.013189144, 0.06977469, -0.030133663, -0.013400961, -0.06195383, -0.01763788, -0.00073777395, 0.014173, -0.020227041, -0.002678048, 0.03331537, -0.017337443, 0.029439004, -0.02108535, 0.0019703307, 0.0033391328, -0.032127813, -0.06741484, 0.033954434, -0.06429553, -0.0028248366, -0.007518107, -0.04252335, -0.008083261, 0.005591775, 0.042388357, 0.037710037, 0.015690051, 0.011415067, 0.045998093, 0.023077747, 0.022285031, 0.007848019, 0.02653441, -0.028178923, 0.064425625, 0.019558094, 0.006392563, -0.061338507, 0.019965772, 0.027877463, 0.031860583, 0.08822621, 0.0021118685, -0.013568788, 0.012213977, 0.011794686, 0.011746287, -0.04255532, -0.031801987, -0.009595038, 0.0044615394, -0.002963593, -0.022992183, 0.032160193, 0.036371764, 0.018271908, 0.034596313, 0.032899648, -0.008284464, 0.017361738, -0.0075536575, -0.062124927, -0.040073045, 0.010940779, -0.035344217, -0.03577145, -0.044543967, -0.028875787, -0.0077759298, -0.0059001166, 0.026630562, -0.056429848, -0.018643763, 0.045417435, 0.015638778, 0.05498249, -0.015287093, 0.032274425, 0.059427407, -0.007727988, -0.041915257, -0.06761483, -0.015008637, -0.011633817, -0.04473641, 0.010761395, 0.04737682, 0.020224057, -0.039018407, -0.023809792, -0.0315297, -0.045886453, 0.027362607, -0.06854348, 0.02782585, 0.041447368, 0.03809086, -0.032552384, 0.058733862, -0.014951105, 0.03515661, -0.028550006, 0.004903542, 0.047009293, 0.08951287, -0.05251088, 0.0056321933, 0.02853476, -0.017408922, -0.0007259677, 0.01570457, 0.05601831, 0.00045348034, 0.033282496, -0.06320938, -0.003964976, -0.0066398317, 0.044095527, 0.02724642, -0.0070754625, -0.010164292, 0.022364479, 0.026957694, 0.011359415, -0.00507983, -0.042396206, 0.02793773, 0.013252221, -0.012907043, 0.012618729, -0.03461427, -0.0480666, 0.014978358, -0.019859375, 0.017425848, 0.03661084, 0.004448306, 0.011517026, -0.018720599, -0.035887994, -0.038497705, -0.028822478, -0.006980379, 0.05472221, -0.04450025, -0.05632212, 0.045090903, 0.004140744, 0.030121047, 0.068631604, -0.018199425, -0.04147701, 0.0013565508, 0.0387545, 0.0010663066, -0.016067801, -0.011043612, -0.014498814, 0.041405533, 0.025963515, 0.0022729675, -0.027385194, -0.045072332, 0.014473708, 0.054770585, 0.04293996, -0.04913008, -0.045752753, -0.014389631, 0.02197701, 0.02710036, -0.0025271992, -0.015185406, -0.005807928, 0.032912966, 0.0006084796, -0.0029794278, 0.08321632, 0.016833676, -0.022266852, -0.027260445, -0.042198524, 0.056657296, 0.059921164, 0.042768054, 0.0024016933, -0.061421957, 0.011560237, -0.017120233, -0.0030691596, 0.00937358, 0.037908707, 0.0679356, -0.04137055, 0.055778105, -0.027445912, -0.001642649, -0.016804658, 0.008598339, 0.028056495, -0.052670244, 0.021219566, 0.007842755, -0.028742116, 0.0019134064, -0.011207349, 0.022336535, 0.05224679, -0.045004237, 0.053058077, -0.004145731, 0.020089436, 0.013568293, -0.035345018, -0.021599242, 0.029634938, -0.0030767056, 0.0686824, 0.043787353, 0.019378748, -0.041557625, -0.033745863, 0.00733813, 0.039741762, 0.004618008, -0.024221482, -0.0023694562, -0.012751473, -0.034096964, 0.015345173, 0.02447983, -0.0373734, -0.02011196, -0.048121143, 0.008796358, -0.041615844, 0.01688993, 0.030263092, 0.064987145, 0.046141334, -0.045482814, -0.0042524887, 0.057846647, -0.030249111, 0.02020339, -0.025006311, -0.040750742, -0.021008646, -0.06500083, 0.0048085167, -0.046050336, 0.0054290835, 0.052986104, -0.05343075, 0.01965922, 0.0053141345, 0.0042541022, 0.047251824, -0.03221435, 0.016750986, -0.00782761, 0.008853598, -0.05310723, -0.0019603225, -0.008194657, -0.009547082, 0.009860242, -0.017178293, 0.0057994653, 0.043968532, -0.03219604, 0.005740256, 0.04186425, 0.0028427385, 0.015410917, 0.036574762, 0.028851394, 0.05251656, 0.044300422, -0.00097071595, -0.017772328, 0.0455604, 0.032544456, -0.04255213, 0.02168945, 0.004174097, -0.010517134, -0.05498138, 0.02181252, -0.02523621, 0.017497573, -0.024966814, 0.035447225, -0.018723119, 0.03550715, 0.03292103, -0.049964573, -0.017485676, -0.0026190714, 0.010797091, 0.07539779, -0.00016223868, -0.003050531, -0.0030678746, -0.042440422, 0.0101693515, 0.023200147, 0.023714352, -0.0064566624, -0.041058153, -0.057399467, -0.026196888, -0.0050000492, 0.009607953, 0.014601306, 0.001973055, -0.024421114, -0.0732341, 0.028464071, -0.061172992, 0.0232216, 0.019396607, 0.03719588, 0.0111135235, -0.05751737, -0.014568351, 0.012197814, -0.045055896, 0.0032212588, 0.05991664, 0.035642795, -0.04810081, 0.016432445, 0.0027162533, -0.0044268565, 0.01705664, -0.027747115, -0.06991077, -0.033055726, 0.016111575, 0.024187468, -0.06343779, 0.024146182, 0.019591013, 0.052808408, 0.030370824, -0.010137371, -0.006190875, 0.043305665, -0.0165903, -0.034973886, -0.062047835, 0.053061135, -0.027758272, 0.020876635, 0.0036199368, 0.00879301, -0.021009615, -0.029611062, -0.04211273, 0.04090435, -0.04021969, 0.028844664, -0.012987946, -0.0564927, -0.07249975, -0.0259275, 0.04196351, -0.03435903, 0.05718409, -0.030328413, -0.08229106, -0.055770762, 0.03630975, -0.034760907, 0.00054879417, 0.021047873, 0.072642975, 0.034297425, -0.04290415, 0.0116295945, 0.04317626, 0.025564436, -0.009465236, -0.007362335, 0.07016368, 0.048913628, -0.0051406906, 0.062317465, 0.0032403183, 0.014619263, -0.01384008, -0.017416125, -0.053162854, 0.043165516, -0.01638602, -0.06531059, -0.048403855, -0.021571305, 0.034827694, 0.015485262, 0.010537887, 0.037235845, -0.027256703, 0.01626456, -0.0027154225, -0.0979388, -0.0068774517, 0.002590695, -0.005167225, 0.031932924, -0.016133144, -0.029611679, 0.028033081, 0.069326274, -0.0000070652745, -0.020393176, -0.0063950093, 0.023815803, 0.07099068, 0.050766762, -0.040337384, -0.001003275, -0.0652714, -0.0052209944, -0.02312912, 0.013849191, -0.026310049, -0.023425013, -0.04465653, -0.009056439, -0.047710303, 0.0593378, 0.054269917, -0.03018837, -0.009661419, -0.078084394, 0.029557053, -0.009751387, 0.03599116, 0.014580041, 0.049669903, -0.017366845, -0.01187832, 0.031961273, 0.014016153, 0.031833317, -0.0029964242, -0.010907685, -0.03270562, -0.017315654, 0.018068928, 0.010936387, 0.007036878, -0.02308606, -0.04356114, -0.012266045, 0.009524769, 0.054658215, 0.020560471, -0.06412476, -0.04694482, -0.014909701, 0.024904164, 0.05259251, -0.012254937, -0.0048896796, -0.0072809425, -0.015564722, -0.0017214327, -0.02432279, -0.005291404, -0.0055601713, 0.008851829, -0.049824335, -0.034753803, -0.033773642, -0.05969345, -0.05878465, 0.021867614, -0.02654156, -0.030088758, -0.004052159, -0.0037078303, 0.018328678, 0.017710697, -0.0069703492, -0.025681809, 0.059779778, 0.007263781, 0.030907065, 0.022000073, 0.010014955, 0.02152092, -0.023167983, 0.035864413, 0.12227517, 0.03313528, 0.027485542, -0.016374348, 0.00008891975, 0.023746016, -0.022095548, -0.0589547, 0.0007231653, 0.00043499618 ]" .
_:bd5ff24a-4ec2-4066-9652-5171f57ef771 <dgraph.type> "Author" .
_:bd5ff24a-4ec2-4066-9652-5171f57ef771 <Author.name> "Selam Gebrekidan" .
_:bd5ff24a-4ec2-4066-9652-5171f57ef771 <Author.article> _:89285c4b-ab8b-424c-9563-3236d425c2c8 .
_:e2476b0a-133c-4685-a8d8-a1b98236c346 <dgraph.type> "Author" .
_:e2476b0a-133c-4685-a8d8-a1b98236c346 <Author.name> "Joy Dong" .
_:e2476b0a-133c-4685-a8d8-a1b98236c346 <Author.article> _:89285c4b-ab8b-424c-9563-3236d425c2c8 .
_:824a5abb-4454-4115-a940-7dee8fa0fc60 <dgraph.type> "Author" .
_:824a5abb-4454-4115-a940-7dee8fa0fc60 <Author.name> "Chang W. Lee" .
_:824a5abb-4454-4115-a940-7dee8fa0fc60 <Author.article> _:89285c4b-ab8b-424c-9563-3236d425c2c8 .
_:e2cdac1e-7a47-4cd8-8fd9-897bd20f1c80 <dgraph.type> "Author" .
_:e2cdac1e-7a47-4cd8-8fd9-897bd20f1c80 <Author.name> "Weiyi Cai" .
_:e2cdac1e-7a47-4cd8-8fd9-897bd20f1c80 <Author.article> _:89285c4b-ab8b-424c-9563-3236d425c2c8 .
_:11e2c957-ab09-47cb-9754-150657c615ba <dgraph.type> "Topic" .
_:11e2c957-ab09-47cb-9754-150657c615ba <Topic.name> "Frauds and Swindling" .
_:89285c4b-ab8b-424c-9563-3236d425c2c8 <Article.topic> _:11e2c957-ab09-47cb-9754-150657c615ba .
_:ffaa96d6-5af6-466c-8c2b-0151790b671b <dgraph.type> "Topic" .
_:ffaa96d6-5af6-466c-8c2b-0151790b671b <Topic.name> "Money Laundering" .
_:89285c4b-ab8b-424c-9563-3236d425c2c8 <Article.topic> _:ffaa96d6-5af6-466c-8c2b-0151790b671b .
_:938fce1b-f6de-4caf-aef0-a5e9dcc06d68 <dgraph.type> "Topic" .
_:938fce1b-f6de-4caf-aef0-a5e9dcc06d68 <Topic.name> "Banking and Financial Institutions" .
_:89285c4b-ab8b-424c-9563-3236d425c2c8 <Article.topic> _:938fce1b-f6de-4caf-aef0-a5e9dcc06d68 .
_:73a8ba4b-cc46-4f8d-9d8b-8db5742ee8a9 <dgraph.type> "Topic" .
_:73a8ba4b-cc46-4f8d-9d8b-8db5742ee8a9 <Topic.name> "Robberies and Thefts" .
_:89285c4b-ab8b-424c-9563-3236d425c2c8 <Article.topic> _:73a8ba4b-cc46-4f8d-9d8b-8db5742ee8a9 .
_:fb47eee6-1f37-4ba9-b3a3-c8c745a95b6a <dgraph.type> "Topic" .
_:fb47eee6-1f37-4ba9-b3a3-c8c745a95b6a <Topic.name> "Virtual Currency" .
_:89285c4b-ab8b-424c-9563-3236d425c2c8 <Article.topic> _:fb47eee6-1f37-4ba9-b3a3-c8c745a95b6a .
_:7207a7e0-6e79-4c43-98cc-e42f683f3b0a <dgraph.type> "Topic" .
_:7207a7e0-6e79-4c43-98cc-e42f683f3b0a <Topic.name> "Computers and the Internet" .
_:89285c4b-ab8b-424c-9563-3236d425c2c8 <Article.topic> _:7207a7e0-6e79-4c43-98cc-e42f683f3b0a .
_:4f995f34-7696-410d-b078-a4d1ee148a97 <dgraph.type> "Topic" .
_:4f995f34-7696-410d-b078-a4d1ee148a97 <Topic.name> "audio-neutral-immersive" .
_:89285c4b-ab8b-424c-9563-3236d425c2c8 <Article.topic> _:4f995f34-7696-410d-b078-a4d1ee148a97 .
_:d7adb31c-8e55-4fa9-ab43-a459ced1029d <dgraph.type> "Topic" .
_:d7adb31c-8e55-4fa9-ab43-a459ced1029d <Topic.name> "audio-neutral-suspenseful" .
_:89285c4b-ab8b-424c-9563-3236d425c2c8 <Article.topic> _:d7adb31c-8e55-4fa9-ab43-a459ced1029d .
_:a26e6f17-c097-4eed-95fe-7aeb2c69d437 <dgraph.type> "Organization" .
_:a26e6f17-c097-4eed-95fe-7aeb2c69d437 <Organization.name> "Huione Group" .
_:89285c4b-ab8b-424c-9563-3236d425c2c8 <Article.org> _:a26e6f17-c097-4eed-95fe-7aeb2c69d437 .
_:0f2945ba-37bb-4ff9-affe-252050811d67 <dgraph.type> "Organization" .
_:0f2945ba-37bb-4ff9-affe-252050811d67 <Organization.name> "Tether Operations Ltd" .
_:89285c4b-ab8b-424c-9563-3236d425c2c8 <Article.org> _:0f2945ba-37bb-4ff9-affe-252050811d67 .
_:161a05a2-81ea-4863-b982-fe48325f45de <dgraph.type> "Organization" .
_:161a05a2-81ea-4863-b982-fe48325f45de <Organization.name> "Telegram LLC" .
_:89285c4b-ab8b-424c-9563-3236d425c2c8 <Article.org> _:161a05a2-81ea-4863-b982-fe48325f45de .
_:282dca5c-dd1b-49f6-9919-4c9c42d4845f <dgraph.type> "Geo" .
_:282dca5c-dd1b-49f6-9919-4c9c42d4845f <Geo.name> "Phnom Penh (Cambodia)" .
_:282dca5c-dd1b-49f6-9919-4c9c42d4845f <Geo.location> "{'type':'Point','coordinates':[104.9282,11.5564]}"^^<geo:geojson> .
_:89285c4b-ab8b-424c-9563-3236d425c2c8 <Article.geo> _:282dca5c-dd1b-49f6-9919-4c9c42d4845f .
_:e7bd6a4e-3d86-4cf1-a226-61cd3a89c278 <dgraph.type> "Geo" .
_:e7bd6a4e-3d86-4cf1-a226-61cd3a89c278 <Geo.name> "Cambodia" .
_:e7bd6a4e-3d86-4cf1-a226-61cd3a89c278 <Geo.location> "{'type':'Point','coordinates':[104.9910,12.5657]}"^^<geo:geojson> .
_:89285c4b-ab8b-424c-9563-3236d425c2c8 <Article.geo> _:e7bd6a4e-3d86-4cf1-a226-61cd3a89c278 .
_:2ec51336-568e-4c86-8d77-1592afa83611 <dgraph.type> "Image" .
_:2ec51336-568e-4c86-8d77-1592afa83611 <Image.caption> "Huione is a constellation of affiliates. The headquarters of one of its companies, Huione Pay, is in Phnom Penh, Cambodia." .
_:2ec51336-568e-4c86-8d77-1592afa83611 <Image.url> "https://static01.nyt.com/images/2025/03/10/multimedia/00int-moneylaundering-03-hpgl/00int-moneylaundering-03-hpgl-thumbStandard.jpg" .
_:2ec51336-568e-4c86-8d77-1592afa83611 <Image.article> _:89285c4b-ab8b-424c-9563-3236d425c2c8 .
_:Article_100000010064414 <dgraph.type> "Article" .
_:Article_100000010064414 <Article.title> "It’s Trump vs. the Courts, and It Won’t End Well for Trump" .
_:Article_100000010064414 <Article.abstract> "The judiciary will never surrender to the president its constitutional role to interpret the Constitution." .
_:Article_100000010064414 <Article.embedding> "[0.05038249120116234, 0.058795228600502014, -0.11216231435537338, -0.021286925300955772, 0.04817740619182587, 0.0414428673684597, -0.04697953537106514, 0.037348028272390366, -0.011797518469393253, -0.020323075354099274, 0.0017164889723062515, -0.01714685745537281, 0.021885693073272705, 0.04376671463251114, 0.04797733202576637, -0.01547605823725462, 0.02192000113427639, -0.02175835520029068, 0.002948863198980689, 0.006321301683783531, -0.04765839874744415, -0.001094080857001245, -0.02511022984981537, 0.04317215085029602, 0.08050080388784409, 0.05602758377790451, 0.03712429106235504, -0.025082381442189217, -0.013643899001181126, 0.024736950173974037, -0.007877232506871223, 0.05271192267537117, 0.019025910645723343, -0.023699987679719925, 0.04814165458083153, -0.08723080903291702, 0.05971049889922142, 0.007902886718511581, 0.03182042017579079, -0.04329095780849457, -0.0647377073764801, -0.010789471678435802, -0.083918996155262, -0.043435581028461456, 0.08296576887369156, -0.033632297068834305, 0.060239460319280624, 0.05735386908054352, 0.03676137700676918, -0.019326206296682358, 0.022676490247249603, -0.09239562600851059, 0.04570508375763893, -0.019836582243442535, 0.061863817274570465, 0.07597476243972778, 0.017045240849256516, 0.0498955175280571, -0.040841151028871536, 0.01170419529080391, 0.09735319018363953, -0.00849493034183979, -0.05664645880460739, 0.03504382446408272, -0.008737048134207726, 0.01733621582388878, -0.032963432371616364, 0.046866267919540405, 0.006506554316729307, -0.014955011196434498, 0.039385631680488586, 0.0008437118376605213, -0.004841649904847145, -0.024966398254036903, 0.04792783036828041, -0.03044090047478676, 0.014011336490511894, -0.01905972696840763, -0.04364760220050812, -0.016419796273112297, 0.03227745369076729, -0.06663628667593002, 0.045762546360492706, -0.023100202903151512, 0.0024865821469575167, -0.010295139625668526, 0.011217073537409306, 0.010327308438718319, -0.032288603484630585, 0.1056782454252243, 0.014712595380842686, 0.033389922231435776, 0.03636026382446289, 0.02809780277311802, -0.024538181722164154, -0.017350109294056892, 0.00914673786610365, 0.008687303401529789, -0.03622390702366829, -0.006120243575423956, -0.048699501901865005, -0.023038093000650406, 0.02137245610356331, -0.018966689705848694, 0.04694816470146179, 0.01561683602631092, 0.052321940660476685, 0.022184697911143303, 0.01711142435669899, -0.04968259111046791, -0.052845682948827744, 0.058768659830093384, -0.013000226579606533, -0.007689858786761761, -0.0008546947501599789, -0.007615725975483656, 0.0523887537419796, -0.052580323070287704, 0.005650855600833893, 0.02242126874625683, 0.007889088243246078, 0.007340617943555117, -0.012117046862840652, -0.005830872338265181, -0.038269203156232834, 0.016449380666017532, -0.023527739569544792, 0.04016977921128273, -0.024063676595687866, -0.06637314707040787, -0.06640496104955673, 0.004637458827346563, -0.03460118919610977, 0.034495968371629715, 0.043583836406469345, 0.017685893923044205, 0.007280079182237387, -0.03072427213191986, 0.008505169302225113, 0.03463548794388771, -0.02699446678161621, 0.004232228267937899, 0.03595457226037979, 0.04475175589323044, 0.003940397407859564, -0.041795384138822556, 0.08309721946716309, -0.04651130735874176, -0.0179553534835577, -0.016547197476029396, 0.03209727630019188, 0.0439239963889122, -0.02459815889596939, 0.026868589222431183, 0.026411838829517365, -0.052671339362859726, 0.024068176746368408, 0.0058274115435779095, 0.0018858280964195728, 0.0059128995053470135, 0.06166921928524971, 0.010814705863595009, -0.030825752764940262, 0.048038456588983536, -0.05551855266094208, -0.00420160498470068, 0.010119279846549034, 0.0397237129509449, 0.01743854023516178, 0.02840823493897915, -0.05217785760760307, -0.0028160109650343657, -0.028237177059054375, 0.055129896849393845, 0.0728059783577919, -0.022510355338454247, -0.024135567247867584, -0.024542905390262604, 0.024327557533979416, -0.03793802857398987, 0.044758930802345276, -0.03508693352341652, 0.00999172031879425, -0.029989011585712433, -0.01564241573214531, 0.02924221009016037, 0.02445463463664055, 0.028683403506875038, 0.021463626995682716, -0.006096207536756992, -0.006636155769228935, -0.004264455754309893, -0.0074067553505301476, 0.007472366094589233, -0.020413756370544434, -0.02916806936264038, 0.01665566861629486, 0.04013733193278313, -0.018470995128154755, -0.02998230792582035, -0.03246713802218437, -0.03073200024664402, 0.010016419924795628, -0.011534568853676319, -0.040116194635629654, 0.010491706430912018, -0.027949964627623558, 0.00996584165841341, -0.09300166368484497, -0.0037628766149282455, 0.07623939961194992, -0.004190622363239527, 0.012201444245874882, -0.02054835855960846, 0.04755444452166557, -0.038993943482637405, 0.021817760542035103, -0.03944282978773117, 0.022789612412452698, 0.05862411484122276, -0.00909154862165451, 0.02118791453540325, 0.02693791873753071, -0.06342943757772446, -0.0006572428392246366, -0.014406759291887283, -0.04625315219163895, -0.03271813690662384, 0.006573909427970648, 0.012736557051539421, 0.03653808310627937, -0.07507583498954773, 0.06453768908977509, 0.03914172574877739, -0.05687256529927254, 0.012534432113170624, 0.026428574696183205, 0.011032231152057648, 0.05347106233239174, 0.0031873006373643875, -0.06171061098575592, 0.007092044688761234, 0.019716637209057808, -0.05124755576252937, -0.027481745928525925, 0.020125150680541992, 0.018131816759705544, -0.08442474901676178, 0.027564380317926407, 0.022869231179356575, 0.06489279121160507, 0.017441434785723686, 0.02600848488509655, 0.02943369559943676, -0.000572650576941669, -0.07110941410064697, 0.015273635275661945, -0.007780193816870451, -0.021677719429135323, -0.09940658509731293, 0.030053522437810898, -0.054057493805885315, 0.02906983159482479, -0.03224460408091545, -0.013242591172456741, -0.05494881421327591, 0.032036878168582916, 0.02765725553035736, -0.0028018581215292215, -0.07974174618721008, 0.015735609456896782, 0.09462333470582962, 0.031219003722071648, 0.08168164640665054, 0.02342136949300766, 0.03194839134812355, -0.03858589008450508, -0.020989542827010155, -0.03506401926279068, -0.0348326750099659, -0.030951546505093575, 0.027690252289175987, -0.031093187630176544, -0.03259289637207985, 0.0072990963235497475, -0.02033178135752678, 0.008813376538455486, 0.012775355018675327, -0.01250151265412569, 0.008187174797058105, -0.0023697877768427134, 0.02982313744723797, -0.03918955475091934, 0.032010577619075775, -0.021396396681666374, 0.04638639837503433, 0.021916968747973442, -0.015348323620855808, 0.040150489658117294, -0.048670362681150436, 0.025582414120435715, 0.0026649748906493187, 0.0022588407155126333, 0.02771640755236149, -0.05871456488966942, -0.0011070889886468649, 0.019556833431124687, 0.015401728451251984, 0.06938262283802032, -0.007585637737065554, -0.0481351874768734, -0.00110055529512465, 0.024595344439148903, -0.02971971221268177, -0.07961209118366241, 0.003501464147120714, -0.0008602032903581858, 0.011136336252093315, 0.04647476598620415, 0.018537059426307678, 0.018796183168888092, 0.03901093825697899, -0.01730465516448021, -0.050305720418691635, 0.004829796031117439, 0.06565339118242264, -0.013151961378753185, 0.029650012031197548, -0.04580234736204147, -0.026646384969353676, 0.021755924448370934, 0.0428791381418705, 0.058355867862701416, 0.021115195006132126, -0.0016149693401530385, 0.011977804824709892, -0.003629880491644144, -0.030544724315404892, 0.019788900390267372, 0.031313616782426834, 0.09668336808681488, -0.03805971518158913, 0.02627474255859852, 0.006774241104722023, 0.029789479449391365, -0.005834420211613178, -0.0010006697848439217, -0.007588276173919439, -0.015628529712557793, -0.009973129257559776, 0.018383167684078217, -0.00014107412425801158, 0.02646421268582344, 0.014242297038435936, 0.024884246289730072, 0.012977246195077896, 0.039141226559877396, 0.01660335063934326, -0.02595776692032814, -0.022408541291952133, -0.0030090908985584974, -0.015095042996108532, 0.04122914746403694, 0.0077318004332482815, 0.00600758520886302, 0.02754615806043148, 0.015942417085170746, 0.03188956528902054, 0.02160094678401947, 0.02226310595870018, -0.06262847781181335, -0.019053766503930092, 0.037759050726890564, 0.005418005399405956, 0.011238254606723785, -0.04758363217115402, -0.02071199007332325, -0.017017502337694168, 0.015075252391397953, -0.018464231863617897, 0.034438181668519974, -0.010117633268237114, -0.011959169991314411, -0.013364541344344616, 0.04652421176433563, -0.031502433121204376, 0.024947652593255043, -0.03725329414010048, -0.028422845527529716, -0.0036945154424756765, -0.020497895777225494, -0.009818361140787601, -0.03988558426499367, 0.02258661389350891, -0.015131406486034393, -0.04237306863069534, -0.020223967730998993, 0.012813649140298367, -0.011941546574234962, -0.03589385002851486, -0.008790423162281513, -0.06319613009691238, -0.020607881247997284, -0.00388156995177269, 0.0028946620877832174, 0.04707051441073418, 0.005329711828380823, -0.08094963431358337, -0.027785882353782654, -0.017540251836180687, 0.04216675087809563, 0.020547965541481972, -0.0313473716378212, -0.015363886021077633, 0.05321437120437622, -0.00994417816400528, 0.028447570279240608, 0.014380505308508873, -0.0018638515612110496, 0.013458986766636372, 0.0637432187795639, 0.04285871237516403, 0.0356140062212944, 0.008157864212989807, 0.03915967419743538, -0.0018778559751808643, 0.008501824922859669, 0.02671061083674431, -0.012386936694383621, -0.02181047946214676, -0.0050231050699949265, -0.025384478271007538, 0.0655684694647789, -0.0295538492500782, -0.03638719394803047, -0.021702473983168602, -0.0247305016964674, -0.004432926885783672, -0.029824620112776756, 0.10686944425106049, 0.02722608484327793, -0.05778251215815544, -0.05013261362910271, 0.01871374249458313, 0.007663625292479992, 0.07527028024196625, 0.022271733731031418, 0.04499734193086624, -0.03681841865181923, -0.06281627714633942, 0.015319202095270157, 0.002323899883776903, -0.015593198128044605, 0.01050935871899128, 0.04398168995976448, -0.003611965337768197, -0.062292877584695816, 0.008509237319231033, 0.04584096372127533, 0.024243028834462166, -0.023157382383942604, -0.015633881092071533, -0.021108504384756088, 0.05582025274634361, -0.04291731119155884, 0.010924052447080612, -0.010971924290060997, -0.053344786167144775, 0.02897789515554905, 0.02253701351583004, -0.06000944972038269, -0.000788728822953999, 0.041557908058166504, -0.03427810221910477, -0.011103486642241478, -0.03984641283750534, 0.024138672277331352, -0.010788356885313988, 0.05897390469908714, 0.042465344071388245, -0.0024804137647151947, -0.04840341955423355, -0.03582682088017464, -0.034796565771102905, -0.0004399163299240172, 0.06878915429115295, 0.08304701000452042, -0.023558173328638077, -0.016084102913737297, -0.04249172657728195, 0.048878513276576996, 0.031156685203313828, 0.025458622723817825, -0.0057054306380450726, 0.024926038458943367, -0.011081335134804249, -0.03214121237397194, -0.028512511402368546, 0.030801687389612198, 0.03852475434541702, 0.029046641662716866, 0.02671736478805542, -0.00874768104404211, 0.04384639114141464, -0.03427295759320259, -0.019874121993780136, -0.006194400135427713, -0.03637347370386124, -0.06808359175920486, 0.02036312222480774, -0.03429485484957695, -0.007955902256071568, 0.021682875230908394, 0.0716102197766304, 0.06818962842226028, -0.06045995652675629, -0.025537891313433647, 0.018623698502779007, -0.08220860362052917, 0.01673673279583454, 0.015510759316384792, -0.00425098929554224, 0.014149785973131657, -0.0819428414106369, -0.010122752748429775, 0.03757791221141815, 0.050402142107486725, -0.07678540050983429, 0.06142081320285797, 0.017118260264396667, 0.024196457117795944, 0.02589448355138302, -0.023841941729187965, -0.004603979177772999, 0.014954416081309319, 0.016053033992648125, -0.07459896802902222, -0.006217937916517258, 0.04232024401426315, 0.002804424846544862, -0.0009742106194607913, 0.017131956294178963, -0.008973225019872189, 0.02532798796892166, 0.02948184870183468, 0.01445115078240633, -0.06819204241037369, 0.0030644929502159357, -0.04740794375538826, -0.022151771932840347, -0.02877454273402691, 0.00740148825570941, -0.036958467215299606, -0.022518742829561234, 0.049273744225502014, -0.021695896983146667, 0.02548009715974331, -0.033548783510923386, -0.033957019448280334, -0.04511905834078789, 0.01644589565694332, 0.09950347989797592, 0.029682204127311707, 0.0037318626418709755, -0.024713920429348946, -0.056420356035232544, 0.006649395916610956, -0.059271883219480515, -0.027533942833542824, 0.0433354452252388, 0.027225874364376068, -0.06508076190948486, -0.014319908805191517, 0.02032507210969925, -0.014297233894467354, -0.003951805178076029, -0.04910515621304512, -0.059487175196409225, 0.006263994611799717, -0.037078987807035446, 0.0630621388554573, -0.03715026378631592, -0.005171319004148245, 0.0036575556732714176, -0.025611134245991707, 0.0021267232950776815, -0.004813394974917173, 0.02001875638961792, 0.02062581665813923, 0.0558105930685997, -0.0001516431220807135, -0.02491859532892704, 0.010159192606806755, 0.0008590157376602292, -0.030529988929629326, 0.0057417829521000385, 0.0076438188552856445, -0.00665288558229804, -0.0016580213559791446, -0.027736986055970192, -0.0522361621260643, 0.02398715727031231, 0.057094756513834, -0.04685121029615402, 0.01694015972316265, -0.0011215705890208483, 0.01665646955370903, 0.014646478928625584, 0.00659112399443984, -0.0313909687101841, -0.02271713875234127, 0.016802560538053513, -0.020180029794573784, -0.06474654376506805, 0.00842411071062088, -0.00699396338313818, 0.06381089240312576, -0.015864890068769455, -0.06843926757574081, -0.02728293463587761, 0.02541944943368435, -0.00025000033201649785, 0.01574527658522129, 0.02913728542625904, 0.014364532195031643, -0.013126437552273273, -0.05842083692550659, 0.012340355664491653, 0.0506250374019146, 0.010096854530274868, 0.010727216489613056, 0.006305173505097628, -0.00933822337538004, -0.023963838815689087, -0.0370502769947052, -0.03508960083127022, -0.042263735085725784, -0.03748786076903343, -0.010153799317777157, 0.05576179549098015, 0.02584952488541603, 0.028048200532794, 0.010344802401959896, 0.03341485932469368, -0.03994154557585716, 0.025773555040359497, 0.03673772141337395, 0.011175928637385368, -0.013135702349245548, -0.0762358158826828, 0.03418443724513054, 0.03754375874996185, 0.029385406523942947, -0.03219980373978615, -0.008166473358869553, -0.002033072290942073, 0.017162278294563293, -0.03685037046670914, -0.01283805537968874, -0.052200861275196075, 0.05913116782903671, 0.02924790233373642, -0.0012907821219414473, 0.018856579437851906, -0.013996345922350883, -0.018615050241351128, 0.03609275072813034, -0.028826240450143814, -0.050501346588134766, -0.010146462358534336, 0.02554083615541458, -0.018776096403598785, 0.06737877428531647, -0.03390148654580116, 0.02968483790755272, -0.033929530531167984, -0.025306638330221176, 0.014661352150142193, 0.059862952679395676, 0.028974590823054314, -0.03533853963017464, 0.005910288542509079, 0.08462423831224442, -0.03528030961751938, -0.00982168409973383, -0.03216729685664177, 0.05536894127726555, -0.039683155715465546, -0.01244601234793663, -0.04495496302843094, -0.017416859045624733, -0.05886140093207359, 0.029740329831838608, -0.031036866828799248, -0.01986580155789852, 0.002625726629048586, -0.010517681017518044, 0.006570639554411173, -0.018686508759856224, 0.0038424599915742874, -0.024049604311585426, -0.0026526509318500757, -0.009706133976578712, 0.05907558649778366, -0.06307557225227356, -0.024534698575735092, -0.04068480804562569, -0.03774971514940262, -0.03183687478303909, 0.01323347631841898, 0.0041253394447267056, 0.025951143354177475, -0.009037411771714687, 0.06197737529873848, 0.013797340914607048, -0.00910097360610962, -0.03678758069872856, -0.02690425142645836, -0.0013392851687967777, -0.03684156388044357, 0.041437216103076935, -0.040483664721250534, -0.02292501926422119, -0.03657152131199837, -0.060516003519296646, -0.014459939673542976, -0.0021345734130591154, -0.0601021982729435, 0.0019954005256295204, -0.03621481731534004, -0.02448601834475994, -0.004538543522357941, -0.04938667267560959, 0.009435062296688557, -0.061629340052604675, 0.04100124537944794, -0.03157318755984306, 0.02254428341984749, -0.021455809473991394, 0.011723588220775127, -0.05574485659599304, -0.002471092389896512, -0.01781153678894043, 0.045153554528951645, 0.03932283818721771, -0.0329207181930542, -0.029692718759179115, -0.00648312084376812, 0.02915620245039463, -0.019401531666517258, 0.024726372212171555, -0.03170626610517502, -0.0092009911313653, 0.044325634837150574, -0.015496624633669853, -2.2015785361872986e-05, 0.056558385491371155, -0.029567047953605652, 0.11307866871356964, 0.03014186955988407, 0.022086679935455322, -0.019603662192821503, 0.05810973048210144, -0.01710583083331585, -0.011829051189124584, -0.04909808933734894, -0.018814222887158394, 0.029482340440154076]" .
_:Article_100000010064414 <Article.uri> "nyt://article/f44c637b-e423-55aa-b0c0-9ee3d8edf387" .
_:Article_100000010064414 <Article.url> "https://www.nytimes.com/2025/03/23/opinion/trump-judge-venezuela-deportation.html" .
_:Article_100000010064414 <Article.published> "2025-03-23"^^<xs:dateTime> .
_:Author_JMichaelLuttig <dgraph.type> "Author" .
_:Author_JMichaelLuttig <Author.name> "J. Michael Luttig" .
_:Author_JMichaelLuttig <Author.article> _:Article_100000010064414 .
_:Topic_UnitedStatesPoliticsandGovernment <dgraph.type> "Topic" .
_:Topic_UnitedStatesPoliticsandGovernment <Topic.name> "United States Politics and Government" .
_:Article_100000010064414 <Article.topic> _:Topic_UnitedStatesPoliticsandGovernment .
_:Topic_CourtsandtheJudiciary <dgraph.type> "Topic" .
_:Topic_CourtsandtheJudiciary <Topic.name> "Courts and the Judiciary" .
_:Article_100000010064414 <Article.topic> _:Topic_CourtsandtheJudiciary .
_:Topic_FederalCourtsUS <dgraph.type> "Topic" .
_:Topic_FederalCourtsUS <Topic.name> "Federal Courts (US)" .
_:Article_100000010064414 <Article.topic> _:Topic_FederalCourtsUS .
_:Topic_PresidentialPowerUS <dgraph.type> "Topic" .
_:Topic_PresidentialPowerUS <Topic.name> "Presidential Power (US)" .
_:Article_100000010064414 <Article.topic> _:Topic_PresidentialPowerUS .
_:Topic_Deportation <dgraph.type> "Topic" .
_:Topic_Deportation <Topic.name> "Deportation" .
_:Article_100000010064414 <Article.topic> _:Topic_Deportation .
_:Topic_IllegalImmigration <dgraph.type> "Topic" .
_:Topic_IllegalImmigration <Topic.name> "Illegal Immigration" .
_:Article_100000010064414 <Article.topic> _:Topic_IllegalImmigration .
_:Organization_JusticeDepartment <dgraph.type> "Organization" .
_:Organization_JusticeDepartment <Organization.name> "Justice Department" .
_:Article_100000010064414 <Article.org> _:Organization_JusticeDepartment .
_:Organization_RepublicanParty <dgraph.type> "Organization" .
_:Organization_RepublicanParty <Organization.name> "Republican Party" .
_:Article_100000010064414 <Article.org> _:Organization_RepublicanParty .
_:Organization_SupremeCourtUS <dgraph.type> "Organization" .
_:Organization_SupremeCourtUS <Organization.name> "Supreme Court (US)" .
_:Article_100000010064414 <Article.org> _:Organization_SupremeCourtUS .
_:Person_BoasbergJamesE <dgraph.type> "Person" .
_:Person_BoasbergJamesE <Person.name> "Boasberg, James E" .
_:Article_100000010064414 <Article.person> _:Person_BoasbergJamesE .
_:Person_HamiltonAlexander <dgraph.type> "Person" .
_:Person_HamiltonAlexander <Person.name> "Hamilton, Alexander" .
_:Article_100000010064414 <Article.person> _:Person_HamiltonAlexander .
_:Person_MarshallJohn <dgraph.type> "Person" .
_:Person_MarshallJohn <Person.name> "Marshall, John" .
_:Article_100000010064414 <Article.person> _:Person_MarshallJohn .
_:Person_RobertsJohnGJr <dgraph.type> "Person" .
_:Person_RobertsJohnGJr <Person.name> "Roberts, John G Jr" .
_:Article_100000010064414 <Article.person> _:Person_RobertsJohnGJr .
_:Person_TrumpDonaldJ <dgraph.type> "Person" .
_:Person_TrumpDonaldJ <Person.name> "Trump, Donald J" .
_:Article_100000010064414 <Article.person> _:Person_TrumpDonaldJ .
_:38965844-656a-4172-b548-91dcbe9e023e <dgraph.type> "Image" .
_:38965844-656a-4172-b548-91dcbe9e023e <Image.caption> "" .
_:38965844-656a-4172-b548-91dcbe9e023e <Image.url> "https://static01.nyt.com/images/2025/03/21/multimedia/00luttig-wgfj/00luttig-wgfj-thumbStandard.jpg" .
_:38965844-656a-4172-b548-91dcbe9e023e <Image.article> _:Article_100000010064414 .
_:Article_100000009988576 <dgraph.type> "Article" .
_:Article_100000009988576 <Article.title> "The Scammer’s Manual: How to Launder Money and Get Away With It" .
_:Article_100000009988576 <Article.abstract> "Documents and insiders reveal how one of the world’s major money laundering networks operates." .
_:Article_100000009988576 <Article.embedding> "[0.00961915124207735, 0.07751184701919556, -0.2118474245071411, -0.021972330287098885, 0.057156238704919815, -0.0202731154859066, -0.017020752653479576, 0.03639491647481918, -0.005621707066893578, -0.016267752274870872, -0.05293148010969162, -0.010126681067049503, 0.07250042259693146, -0.023925280198454857, 0.045623213052749634, -0.04186142235994339, -0.04304502159357071, -0.025097576901316643, -0.04496070742607117, 0.016891513019800186, -0.07065761834383011, -0.03229387104511261, -0.01308612059801817, 0.036527618765830994, 0.06330248713493347, -0.005751284305006266, -0.029900239780545235, -0.08009859919548035, 0.013764245435595512, -0.05221813917160034, 0.032890435308218, -0.07194230705499649, -0.05712023749947548, -0.03108288161456585, -0.06647130846977234, -0.013517102226614952, 0.04923470690846443, 0.019420651718974113, -0.014028025791049004, 0.019812803715467453, -0.007961602881550789, 0.040302734822034836, -0.0742684155702591, -0.05499899759888649, 0.0007551871822215617, -0.016950709745287895, 0.007561336271464825, -0.019294051453471184, 0.05178140476346016, -0.05403464287519455, -0.015323666855692863, 0.05710078403353691, -0.0034512418787926435, 0.0556379072368145, 0.029124420136213303, -0.044079460203647614, -0.006812221370637417, 0.037481945008039474, -0.0018065761541947722, -0.0801541656255722, 0.08496874570846558, 0.034245315939188004, 0.00020554015645757318, 0.050330206751823425, 0.012106090784072876, -0.024732619524002075, -0.0248411912471056, 0.03664475306868553, 0.020860373973846436, -0.030435387045145035, 0.03843863680958748, -0.015801962465047836, 0.023015905171632767, -0.0016854749992489815, 0.01760799065232277, -0.009927463717758656, -0.018965400755405426, 0.014629902318120003, 0.010007157921791077, 0.06646733731031418, 0.05542993173003197, 0.020191090181469917, 0.026113729923963547, 0.020102815702557564, 0.021069306880235672, 0.03431503847241402, -0.018591616302728653, -0.048364412039518356, -0.034666258841753006, 0.058326564729213715, 0.06404416263103485, 0.010184538550674915, 0.04347497597336769, 0.013428214006125927, -0.03989206627011299, 0.014244183897972107, -0.03220338374376297, 0.028675630688667297, -0.0650133416056633, 0.012817618437111378, 0.0021085434127599, -0.04427453503012657, 0.028098350390791893, 0.012800545431673527, 0.0733502209186554, 0.042314909398555756, 0.029145626351237297, -0.013528008945286274, -0.004642062354832888, 0.026535458862781525, -0.002071481430903077, 0.019693056121468544, -0.013677223585546017, 0.045266225934028625, 0.0012219161726534367, -0.015607824549078941, 0.05734053626656532, 0.007588009815663099, 0.0031283367425203323, 0.04473121836781502, -0.012964907102286816, -0.06996973603963852, -0.03030712530016899, 0.023210469633340836, 0.06962987035512924, 0.026379404589533806, -0.02524801716208458, 0.000773992040194571, 0.005262783728539944, -0.010246852412819862, 0.0004182998090982437, -0.004065764602273703, -0.00994095392525196, -0.03435645252466202, 0.027469640597701073, 0.07097417116165161, -0.042412661015987396, -0.03348338603973389, -0.021559542044997215, 0.043689947575330734, 0.03045741468667984, 0.0016945756506174803, -0.00033138078288175166, 0.0028155685868114233, -0.02652886137366295, -0.06179206445813179, 0.04814790561795235, -0.018100835382938385, -0.026160625740885735, -0.022430332377552986, -0.024131637066602707, 0.03403693437576294, -0.04503524303436279, 0.005425558891147375, -0.00986867118626833, -0.030082106590270996, 0.012519296258687973, -0.026560720056295395, 0.05357349291443825, 0.04410458728671074, 0.013646287843585014, -0.03436680883169174, -0.012221957556903362, 0.03285563364624977, -0.037022665143013, -0.04369169473648071, 0.007167597766965628, 0.07393082976341248, 0.0016578820068389177, 0.02520592510700226, -0.025829270482063293, -0.029058828949928284, -0.07547148317098618, 0.0039641838520765305, 0.0384925901889801, 0.0024611407425254583, 0.016092980280518532, -0.01321965642273426, 0.07636640965938568, -0.028856439515948296, 0.03522363305091858, -0.02584768459200859, 0.038584642112255096, 0.011687809601426125, 0.013304493390023708, 0.017990609630942345, -0.00997051503509283, -0.05184203386306763, 0.038903553038835526, -0.087668277323246, -0.020122123882174492, 0.028842806816101074, -0.01707686483860016, -0.023630738258361816, 0.001390129211358726, -0.002872307086363435, -0.00503362063318491, 0.0127232251688838, 0.07543203234672546, -0.06402827799320221, -0.03191293403506279, -0.022103695198893547, -0.029192540794610977, 0.02090361900627613, 0.02773170731961727, 0.0453663170337677, 0.01342727616429329, 0.016573015600442886, -0.008561813272535801, 0.0360468327999115, 0.0889977514743805, -0.029257453978061676, 0.003304530633613467, -0.009786431677639484, 0.016086716204881668, 0.008326249197125435, -0.005766807124018669, 0.0022251997143030167, -0.017165133729577065, -0.0026251047383993864, 0.004300118889659643, 0.007598059717565775, 0.08201586455106735, -0.014456980861723423, 0.01766645349562168, -0.006121040787547827, -0.07612856477499008, -0.05792873352766037, -0.02180693857371807, 0.013312089256942272, -0.024423861876130104, -0.06896456331014633, 0.034386344254016876, 0.04545734450221062, -0.028259707614779472, -0.01487391721457243, -0.0038134539499878883, 0.03595025837421417, -0.027986526489257812, 0.0458354651927948, -0.022541873157024384, 0.010599303059279919, -0.0941295176744461, -0.03849303722381592, -0.03897751122713089, 0.003465239657089114, -0.012099282816052437, -0.023089425638318062, -0.01693977229297161, 0.03157922253012657, 0.023502575233578682, -0.03278940171003342, 0.0384359247982502, -0.0013598642544820905, 0.010801488533616066, -0.03821505606174469, -0.035099755972623825, 0.041400276124477386, 0.02040908858180046, 0.00579148018732667, 0.008091813884675503, -0.0032242326997220516, 0.06815370172262192, -0.020249733701348305, -0.017481353133916855, -0.049322258681058884, -0.01889844797551632, 0.0005240229074843228, 0.014516675844788551, -0.008749613538384438, -0.0002711733977776021, 0.01927023194730282, -0.008287046104669571, 0.017646262422204018, -0.026921676471829414, 0.013728786259889603, 0.00686973100528121, -0.03723001852631569, -0.07043983042240143, 0.05439385026693344, -0.06785853207111359, 0.001891355263069272, -0.0074833473190665245, -0.04578134045004845, -0.01341241504997015, -0.003900235751643777, 0.046959321945905685, 0.029421361163258553, -0.0008784362580627203, 0.01953306794166565, 0.050895001739263535, 0.021201420575380325, 0.01189956720918417, 0.0036687273532152176, 0.03271525725722313, -0.024085121229290962, 0.06636793911457062, 0.021129174157977104, 0.007365579251199961, -0.05620065703988075, 0.03155935928225517, 0.009481956250965595, 0.02863212674856186, 0.0978347584605217, 0.005369411315768957, -0.01095366571098566, 0.008087263442575932, 0.01981692761182785, 0.014489058405160904, -0.06278949975967407, -0.011960742063820362, -0.000275989412330091, -0.001307618455030024, -0.002622084692120552, -0.01554043684154749, 0.027015922591090202, 0.04784521088004112, 0.00735466368496418, 0.039907924830913544, 0.02239414118230343, -0.015473744831979275, 0.02974540926516056, -0.013642662204802036, -0.054522860795259476, -0.033457379788160324, 0.01186323445290327, -0.021331390365958214, -0.03618095442652702, -0.06130875274538994, -0.03216133266687393, -0.023610321804881096, 0.001189395901747048, 0.01888924650847912, -0.057297419756650925, -0.01062366645783186, 0.03990298882126808, 0.01258351281285286, 0.04568847641348839, -0.018948199227452278, 0.036606766283512115, 0.051359422504901886, -0.006872979458421469, -0.03665727376937866, -0.06275642663240433, -0.030122535303235054, 0.001829583547078073, -0.04690767079591751, 0.01282803900539875, 0.04087992012500763, 0.0254364013671875, -0.03174182027578354, -0.0279832910746336, -0.011128263548016548, -0.04910559952259064, 0.037863656878471375, -0.06493425369262695, 0.01197921484708786, 0.049552660435438156, 0.02305394969880581, -0.022594083100557327, 0.05818929523229599, -0.002735654590651393, 0.02616424486041069, -0.030333131551742554, 0.0034172250889241695, 0.04833132028579712, 0.08150148391723633, -0.045816246420145035, 0.02076355740427971, 0.0280773863196373, -0.01866202801465988, 0.010375759564340115, 0.014574115164577961, 0.057941604405641556, -0.0008631634409539402, 0.05590423196554184, -0.05661485716700554, -0.005179590545594692, 0.009435836225748062, 0.044704001396894455, 0.006479273084551096, -0.003554671537131071, -0.00965220294892788, 0.0005714489961974323, 0.006632519885897636, 0.005947988014668226, -0.01081653032451868, -0.040628787130117416, 0.026921426877379417, 0.020924707874655724, -0.000290124851744622, 0.017990458756685257, -0.028547311201691628, -0.04866660758852959, 0.017264917492866516, -0.020474322140216827, 0.014625140465795994, 0.03167558088898659, 0.025272797793149948, 0.01209953986108303, -0.017308736220002174, -0.04483134299516678, -0.035195447504520416, -0.035613007843494415, 0.0006708086002618074, 0.057962458580732346, -0.06261751800775528, -0.061350565403699875, 0.03543972596526146, -0.009270082227885723, 0.025759825482964516, 0.07567574828863144, -0.008290158584713936, -0.03209218010306358, 0.0025663580745458603, 0.044942814856767654, 0.00931192934513092, 0.002511078491806984, -0.005846492946147919, -0.021095046773552895, 0.0536423921585083, 0.03895355015993118, 0.011556128039956093, -0.011924350634217262, -0.035620931535959244, 0.02860751748085022, 0.04969971626996994, 0.031480301171541214, -0.045802053064107895, -0.03161313757300377, -0.013617363758385181, 0.009831166826188564, 0.03038664534687996, -0.014816981740295887, -0.019100205972790718, -0.007140301633626223, 0.02108062244951725, -0.016044920310378075, 0.002952207811176777, 0.08489999175071716, 0.03359166905283928, -0.03163224086165428, -0.041631441563367844, -0.03197918087244034, 0.03963356837630272, 0.06839071959257126, 0.05659841373562813, 0.020305141806602478, -0.05991426855325699, 0.012651333585381508, -0.011986834928393364, -0.014251192100346088, 0.006389661692082882, 0.03222141042351723, 0.06404533237218857, -0.025733819231390953, 0.05320410802960396, -0.03189397230744362, -0.007628411520272493, -0.0197581946849823, 0.007601141929626465, 0.025782179087400436, -0.039832957088947296, 0.02033354341983795, 0.0010339152067899704, -0.03425801917910576, 0.018575584515929222, -0.01315431110560894, 0.03626828268170357, 0.04669955000281334, -0.0432295985519886, 0.05563889816403389, -0.007047558203339577, 0.027738748118281364, 0.011122340336441994, -0.04257450997829437, -0.01754203997552395, 0.029611432924866676, 0.0026494236662983894, 0.053963448852300644, 0.05213851109147072, 0.019394444301724434, -0.04666690528392792, -0.029682619497179985, -0.0025417073629796505, 0.043553922325372696, 0.015571001917123795, -0.026900213211774826, 0.0033380258828401566, -0.011562691070139408, -0.03809799626469612, 0.013317621313035488, 0.01653544045984745, -0.03022420033812523, -0.02565028890967369, -0.04421127215027809, -0.016597848385572433, -0.0459543839097023, 0.018284093588590622, 0.025167152285575867, 0.05949674919247627, 0.056595828384160995, -0.04587572440505028, -0.01707480102777481, 0.04867714270949364, -0.02030576579272747, 0.016716239973902702, -0.02076064608991146, -0.035335831344127655, -0.005063216667622328, -0.052249133586883545, -0.0016401573084294796, -0.06113724038004875, 0.009827221743762493, 0.04936152696609497, -0.049132395535707474, 0.019346607849001884, 0.005451729986816645, 0.006923553999513388, 0.04209277778863907, -0.028096644207835197, 0.018373874947428703, 0.0028437443543225527, 0.02230113558471203, -0.055678144097328186, -0.00961438100785017, -0.011686642654240131, -0.006761493626981974, 0.012237388640642166, -0.015143916010856628, 0.011241201311349869, 0.04684866964817047, -0.030856603756546974, 0.006922805216163397, 0.035227227956056595, 0.0207511056214571, 0.011575092561542988, 0.026827717199921608, 0.03319241851568222, 0.04111585021018982, 0.05375337973237038, -0.006788127589970827, -0.011991997249424458, 0.060706254094839096, 0.021681534126400948, -0.043537359684705734, 0.031882964074611664, 0.005868036765605211, -0.008436299860477448, -0.04792018234729767, 0.01458408311009407, -0.011307381093502045, 0.004933870397508144, -0.02311914600431919, 0.030535776168107986, -0.02638833597302437, 0.019375033676624298, 0.027088165283203125, -0.053582802414894104, 0.0004066770488861948, -0.0012855735840275884, 0.01806086115539074, 0.08540559560060501, -0.004803819581866264, -0.00821402482688427, 0.014365085400640965, -0.04309416562318802, 0.0030447766184806824, 0.009051733650267124, 0.02868037112057209, -0.00013823497283738106, -0.04970177635550499, -0.06304207444190979, -0.02181728556752205, -0.006745806895196438, 0.015018366277217865, 0.0194927379488945, -0.006965080741792917, -0.018976757302880287, -0.06810754537582397, 0.03701430931687355, -0.04209859296679497, 0.014840620569884777, 0.023390578106045723, 0.03110620006918907, -0.0037461668252944946, -0.051288288086652756, -0.015874149277806282, 0.03071410581469536, -0.04581760987639427, -0.008057706989347935, 0.06118979677557945, 0.020626908168196678, -0.04762501269578934, 0.018225928768515587, -0.026773525401949883, -0.0007960723014548421, 0.012470154091715813, -0.029875285923480988, -0.07165689766407013, -0.03419873118400574, 0.012478811666369438, 0.017982978373765945, -0.061551935970783234, 0.01935802586376667, 0.01927490532398224, 0.06088424101471901, 0.055474113672971725, -0.017734840512275696, -0.001309997751377523, 0.06308315694332123, -0.01920171082019806, -0.03701140731573105, -0.06814407557249069, 0.03068901039659977, -0.037887897342443466, 0.01997082307934761, -0.0038679479621350765, 0.012878837995231152, -0.03605247288942337, -0.042447470128536224, -0.06005585566163063, 0.03703788295388222, -0.034945420920848846, 0.026147661730647087, -0.026105772703886032, -0.058327607810497284, -0.058612506836652756, -0.027565017342567444, 0.05294766649603844, -0.028113920241594315, 0.05236291512846947, -0.018275007605552673, -0.08425755798816681, -0.04396199807524681, 0.019719386473298073, -0.03278883174061775, -0.013445633463561535, 0.011542456224560738, 0.06509555876255035, 0.04803643748164177, -0.0401022844016552, 0.0017988038016483188, 0.0517202690243721, 0.02278948202729225, 0.0008335960446856916, 0.00443787407130003, 0.07076238840818405, 0.0519990511238575, -0.007471687626093626, 0.06894057244062424, 0.014485664665699005, 0.01270509697496891, -0.023908067494630814, -0.02184288203716278, -0.045357171446084976, 0.04366464167833328, -0.012945909053087234, -0.05734879523515701, -0.05435693636536598, -0.02399718575179577, 0.05735364183783531, 0.007531464099884033, 0.009545354172587395, 0.04616665095090866, -0.0194602832198143, 0.020177194848656654, -0.0029073585756123066, -0.10586267709732056, -0.00493124034255743, -0.005821725353598595, 0.00014031729369889945, 0.02878492884337902, -0.021818874403834343, -0.01715104840695858, 0.02524581551551819, 0.07510467618703842, -0.00807313434779644, -0.015898210927844048, 0.009899674914777279, 0.027677105739712715, 0.07317603379487991, 0.030187010765075684, -0.035077281296253204, 0.01506334263831377, -0.04557893052697182, 0.006160695571452379, -0.020929750055074692, 0.004980457480996847, -0.04811522364616394, -0.019872523844242096, -0.02824719250202179, -0.014432284981012344, -0.04463633522391319, 0.06595053523778915, 0.05156726762652397, -0.022946642711758614, -0.021282320842146873, -0.06912046670913696, 0.02681650221347809, -0.012289988808333874, 0.040354423224925995, 0.028368156403303146, 0.03331036865711212, -0.014390945434570312, -0.013395899906754494, 0.023912224918603897, 0.015542503446340561, 0.024598676711320877, -0.001001176773570478, -0.012344755232334137, -0.030800221487879753, -0.017810439690947533, 0.008567790500819683, 0.010117100551724434, -0.0012933425605297089, -0.03617772459983826, -0.04475037753582001, -0.004850700497627258, 0.015027333050966263, 0.06326041370630264, 0.008876025676727295, -0.05728274956345558, -0.03874664008617401, -0.009278367273509502, 0.015093148685991764, 0.059775106608867645, -0.03896361589431763, -0.021855222061276436, -0.02016589045524597, -0.004504490178078413, -0.00022805875050835311, -0.0277190413326025, -0.012456775642931461, 0.0007523685344494879, -0.004988048691302538, -0.04559997469186783, -0.04587370529770851, -0.04316681623458862, -0.07765883952379227, -0.05340832099318504, 0.02397126331925392, -0.04510710760951042, -0.022044314071536064, 0.006461565848439932, -0.0009697407367639244, 0.01966552808880806, 0.021742751821875572, -0.021541954949498177, -0.012771756388247013, 0.062231630086898804, 0.003619229653850198, 0.025890279561281204, 0.027484087273478508, 0.002145038451999426, 0.03811495751142502, -0.024163996800780296, 0.050043318420648575, 0.116086445748806, 0.03278062120079994, 0.036631688475608826, -0.014699306339025497, -0.0004815446154680103, 0.02335752546787262, -0.024495873600244522, -0.05098729580640793, 0.008624924346804619, 0.005866807419806719]" .
_:Article_100000009988576 <Article.uri> "nyt://article/6ff00f2a-405a-5b74-99e6-f98f9a409884" .
_:Article_100000009988576 <Article.url> "https://www.nytimes.com/2025/03/23/world/asia/cambodia-money-laundering-huione.html" .
_:Article_100000009988576 <Article.published> "2025-03-23"^^<xs:dateTime> .
_:Author_SelamGebrekidan <dgraph.type> "Author" .
_:Author_SelamGebrekidan <Author.name> "Selam Gebrekidan" .
_:Author_SelamGebrekidan <Author.article> _:Article_100000009988576 .
_:Author_JoyDong <dgraph.type> "Author" .
_:Author_JoyDong <Author.name> "Joy Dong" .
_:Author_JoyDong <Author.article> _:Article_100000009988576 .
_:Author_ChangWLee <dgraph.type> "Author" .
_:Author_ChangWLee <Author.name> "Chang W. Lee" .
_:Author_ChangWLee <Author.article> _:Article_100000009988576 .
_:Author_WeiyiCai <dgraph.type> "Author" .
_:Author_WeiyiCai <Author.name> "Weiyi Cai" .
_:Author_WeiyiCai <Author.article> _:Article_100000009988576 .
_:Topic_FraudsandSwindling <dgraph.type> "Topic" .
_:Topic_FraudsandSwindling <Topic.name> "Frauds and Swindling" .
_:Article_100000009988576 <Article.topic> _:Topic_FraudsandSwindling .
_:Topic_MoneyLaundering <dgraph.type> "Topic" .
_:Topic_MoneyLaundering <Topic.name> "Money Laundering" .
_:Article_100000009988576 <Article.topic> _:Topic_MoneyLaundering .
_:Topic_BankingandFinancialInstitutions <dgraph.type> "Topic" .
_:Topic_BankingandFinancialInstitutions <Topic.name> "Banking and Financial Institutions" .
_:Article_100000009988576 <Article.topic> _:Topic_BankingandFinancialInstitutions .
_:Topic_RobberiesandThefts <dgraph.type> "Topic" .
_:Topic_RobberiesandThefts <Topic.name> "Robberies and Thefts" .
_:Article_100000009988576 <Article.topic> _:Topic_RobberiesandThefts .
_:Topic_VirtualCurrency <dgraph.type> "Topic" .
_:Topic_VirtualCurrency <Topic.name> "Virtual Currency" .
_:Article_100000009988576 <Article.topic> _:Topic_VirtualCurrency .
_:Topic_ComputersandtheInternet <dgraph.type> "Topic" .
_:Topic_ComputersandtheInternet <Topic.name> "Computers and the Internet" .
_:Article_100000009988576 <Article.topic> _:Topic_ComputersandtheInternet .
_:Topic_audioneutralimmersive <dgraph.type> "Topic" .
_:Topic_audioneutralimmersive <Topic.name> "audio-neutral-immersive" .
_:Article_100000009988576 <Article.topic> _:Topic_audioneutralimmersive .
_:Topic_audioneutralsuspenseful <dgraph.type> "Topic" .
_:Topic_audioneutralsuspenseful <Topic.name> "audio-neutral-suspenseful" .
_:Article_100000009988576 <Article.topic> _:Topic_audioneutralsuspenseful .
_:Organization_HuioneGroup <dgraph.type> "Organization" .
_:Organization_HuioneGroup <Organization.name> "Huione Group" .
_:Article_100000009988576 <Article.org> _:Organization_HuioneGroup .
_:Organization_TetherOperationsLtd <dgraph.type> "Organization" .
_:Organization_TetherOperationsLtd <Organization.name> "Tether Operations Ltd" .
_:Article_100000009988576 <Article.org> _:Organization_TetherOperationsLtd .
_:Organization_TelegramLLC <dgraph.type> "Organization" .
_:Organization_TelegramLLC <Organization.name> "Telegram LLC" .
_:Article_100000009988576 <Article.org> _:Organization_TelegramLLC .
_:Geo_PhnomPenhCambodia <dgraph.type> "Geo" .
_:Geo_PhnomPenhCambodia <Geo.name> "Phnom Penh (Cambodia)" .
_:Geo_PhnomPenhCambodia <Geo.location> "{'type': 'Point', 'coordinates': [104.929, 11.549]}"^^<geo:geojson> .
_:Article_100000009988576 <Article.geo> _:Geo_PhnomPenhCambodia .
_:Geo_Cambodia <dgraph.type> "Geo" .
_:Geo_Cambodia <Geo.name> "Cambodia" .
_:Geo_Cambodia <Geo.location> "{'type': 'Point', 'coordinates': [104.9254, 11.5633]}"^^<geo:geojson> .
_:Article_100000009988576 <Article.geo> _:Geo_Cambodia .
_:caa44a94-9490-496b-be29-cc0e8e8ddaeb <dgraph.type> "Image" .
_:caa44a94-9490-496b-be29-cc0e8e8ddaeb <Image.caption> "Huione is a constellation of affiliates. The headquarters of one of its companies, Huione Pay, is in Phnom Penh, Cambodia." .
_:caa44a94-9490-496b-be29-cc0e8e8ddaeb <Image.url> "https://static01.nyt.com/images/2025/03/10/multimedia/00int-moneylaundering-03-hpgl/00int-moneylaundering-03-hpgl-thumbStandard.jpg" .
_:caa44a94-9490-496b-be29-cc0e8e8ddaeb <Image.article> _:Article_100000009988576 .
_:Article_100000010036616 <dgraph.type> "Article" .
_:Article_100000010036616 <Article.title> "Why Dads Take Their Gay Sons to Hooters" .
_:Article_100000010036616 <Article.abstract> "Many fathers and grandfathers take their gay sons to the bar. It’s become a place of refuge — and how that happened is a curious story." .
_:Article_100000010036616 <Article.embedding> "[-0.02737586572766304, 0.09682928770780563, -0.17000800371170044, -0.041620172560214996, 0.018709277734160423, 0.051669780164957047, -0.0012781595578417182, 0.03900967910885811, -0.030436670407652855, -0.022396542131900787, -0.07485450059175491, 0.013723572716116905, 0.04392634332180023, -0.010300404392182827, -0.01133157592266798, -0.08553589135408401, -0.0008924082503654063, 0.06350750476121902, -0.002407906111329794, -0.03015195205807686, -0.09537636488676071, -0.0063226730562746525, -0.026714231818914413, -0.024014370515942574, 0.0703151598572731, -0.018952855840325356, -0.0001229372137458995, 0.02671828679740429, -0.04122105985879898, 0.05923306569457054, 0.03209163621068001, 0.047348491847515106, -0.035166822373867035, -0.00026923083350993693, -0.02681373991072178, -0.04071126505732536, -0.005176798440515995, 0.05407111346721649, -0.003821189748123288, -0.02711140364408493, 0.029732313007116318, 0.02297082543373108, -0.031266119331121445, -0.05310134217143059, 0.06096380576491356, -0.05312618985772133, 0.007158638909459114, 0.01755085587501526, 0.03520075976848602, -0.027480999007821083, 0.028144923970103264, -0.04971487820148468, -0.02800453081727028, 0.0005554311792366207, 0.05802519619464874, -0.019489290192723274, 0.03208121284842491, -0.0036584786139428616, -0.024288708344101906, 0.030626889318227768, 0.06905081123113632, 0.031564194709062576, -0.0270533449947834, 0.04223552718758583, 0.043072257190942764, 0.03137947991490364, 0.008593293838202953, 0.017510220408439636, 0.040955159813165665, -0.038426030427217484, 0.022005464881658554, 0.0020842207595705986, 0.0007732959347777069, -0.01914294809103012, -0.016648145392537117, 0.029291225597262383, 0.04100428521633148, 0.04920731857419014, -0.02305787242949009, 0.01344993244856596, 0.0724722295999527, -0.03197894245386124, 0.015734706073999405, -0.0237007737159729, -0.05123302340507507, 0.025023972615599632, 0.05385285243391991, -0.026907382532954216, 0.0067596035078167915, 0.04146578535437584, 0.048005711287260056, 0.008215697482228279, 0.022310616448521614, -0.0022001187317073345, -0.05456056818366051, 0.00606703944504261, 0.02081988751888275, 0.02542402222752571, -0.038278914988040924, -0.006032761186361313, 0.0035754444543272257, -0.05838988348841667, -0.020874755457043648, 0.025341179221868515, 0.015784475952386856, 0.020623888820409775, 0.030679477378726006, 0.05351688712835312, 0.007797476835548878, 0.06416180729866028, -0.04837801679968834, 0.045126836746931076, -0.020186835899949074, -0.07778244465589523, 0.018704386427998543, 0.007273005321621895, 0.018544256687164307, -0.02571849524974823, 0.07417857646942139, -7.164065664255759e-06, -0.008685342967510223, 0.03405114635825157, -0.04978036880493164, 0.026222199201583862, 0.04489154368638992, 0.05293944105505943, -0.05498886853456497, 0.021807707846164703, -0.02354436181485653, -0.06669323891401291, -0.010658318176865578, -0.03511672466993332, -0.012532704509794712, -0.026453876867890358, 0.062408093363046646, 0.06508149206638336, 0.043863195925951004, -0.035436127334833145, 0.001408893265761435, 0.02178247645497322, 0.03367999196052551, 0.005305805243551731, 0.013243678025901318, -0.03731878101825714, 0.05129927024245262, 0.02015761099755764, 0.04206274449825287, -0.0363851822912693, -0.06937216967344284, -0.036223478615283966, -0.008215706795454025, 0.0619557686150074, 0.006830214057117701, 0.03352707251906395, 0.007269544526934624, -0.02083573490381241, -0.007292658090591431, 0.019368726760149002, 0.07220540940761566, 0.0547250360250473, 0.05509058013558388, -0.023448726162314415, 0.026690786704421043, -0.02123316191136837, -0.05678975582122803, -0.059265799820423126, 0.01946176216006279, -0.008749742992222309, 0.005978475324809551, -0.03276696801185608, -0.04050230607390404, -0.039563555270433426, 0.028165729716420174, -0.0232184249907732, 0.03117506206035614, -0.04506363719701767, 0.0019241650588810444, -0.050093989819288254, 0.02767244726419449, -0.03651430457830429, -0.0017461669631302357, -0.07329367846250534, 0.03263568878173828, -0.020472150295972824, 0.02518593892455101, -0.0005570711800828576, 0.01341862790286541, -0.007654125802218914, -0.021592725068330765, -0.12364762276411057, -0.004247902426868677, -0.018035495653748512, -0.0286654494702816, -0.04703880101442337, -0.07490614056587219, 0.007441651541739702, 0.010920505039393902, -0.00306674069724977, 0.0018895930843427777, 0.012611876241862774, -0.047200337052345276, -0.01384781301021576, -0.03375369682908058, 0.03956323117017746, -0.014708097092807293, 0.04740351811051369, -0.005957773420959711, -0.027437975630164146, 0.0014531364431604743, 0.009173218160867691, 0.0640597715973854, -0.03935958072543144, -0.021237550303339958, -0.04292790964245796, 0.007614789064973593, 0.030556172132492065, 0.03809681534767151, 0.002948857843875885, 0.0336589589715004, 0.03940415009856224, -0.013409515842795372, 0.04891551658511162, -0.004427120555192232, 0.012456821277737617, 0.07320437580347061, 0.02008519135415554, -0.050311047583818436, -0.0032030001748353243, -0.0014783918159082532, 0.05189834535121918, -0.008325088769197464, -0.0585947260260582, 0.05814807862043381, 0.04175128415226936, -0.03389459103345871, -0.025653496384620667, -0.023014698177576065, 0.06494887173175812, 0.03853248804807663, -0.02793688327074051, -0.007241770159453154, 0.007289619650691748, -0.0181841142475605, 0.015143981203436852, -0.024249672889709473, 0.008079428225755692, 0.013738015666604042, -0.018182728439569473, 0.02660500258207321, 0.026143399998545647, 0.015843510627746582, -0.002859722124412656, -0.021556267514824867, -0.016699906438589096, -0.0067833708599209785, -0.002437414601445198, 0.0019582926761358976, -0.005009924992918968, -0.03373659774661064, -0.05873649939894676, -0.044593121856451035, -0.029472896829247475, 0.02061670459806919, -0.06748244166374207, 0.014101368375122547, -0.010861451737582684, 0.0046368734911084175, 0.00031680925167165697, 0.03478441387414932, -0.03205905109643936, -0.04162733256816864, 0.03611169382929802, 0.06700918823480606, 0.00815883930772543, 0.02045411802828312, -0.039293285459280014, -0.015622027218341827, -0.004830603022128344, -0.007852599956095219, 0.004431647248566151, -0.026025131344795227, -0.01827744022011757, -0.09126700460910797, -0.03354398533701897, 0.0017866571433842182, 0.05555334687232971, 0.033671192824840546, 0.012923075817525387, 0.017486119642853737, 0.03697206452488899, 0.0479467511177063, -0.005747227929532528, -0.05122346058487892, 0.0228168535977602, 0.060643356293439865, 0.034052371978759766, 0.008770833723247051, -0.018066707998514175, -0.025038084015250206, -0.050972357392311096, 0.037582751363515854, -0.020222380757331848, 0.016531141474843025, 0.09471947699785233, 0.014073289930820465, -0.012620273046195507, -0.0003584448422770947, -0.019661827012896538, 0.04490373656153679, 0.005538988392800093, -0.016651922836899757, -0.02047300525009632, -0.02449476532638073, 0.02193770371377468, -0.0595807284116745, 0.041018903255462646, 0.04072895646095276, 0.02357473410665989, 0.0456259548664093, -0.002176538808271289, 0.007947009056806564, -0.00715637905523181, -0.04553801193833351, -0.01594933308660984, 0.04825626686215401, -0.010001926682889462, -0.008576937019824982, 0.03277730569243431, 0.008867510594427586, -0.011446591466665268, 0.00627483893185854, 0.03796831890940666, 0.06060900539159775, -0.015076774172484875, -0.03915475308895111, 0.014686467126011848, 0.04224029555916786, 0.012148126028478146, -0.036180078983306885, 0.04956207424402237, 0.03310924768447876, -0.030824540182948112, 0.027121514081954956, -0.0312606506049633, -0.07695701718330383, 0.05644400045275688, -0.09031475335359573, 0.008418416604399681, 0.04648292809724808, -0.013713371939957142, -0.04499020054936409, 0.0062218341045081615, -0.0548907145857811, 0.023737207055091858, -0.013324335217475891, -0.035654984414577484, 0.014707373455166817, 0.01233385968953371, 0.026844054460525513, -0.02335120365023613, 0.0679907500743866, -0.00992165133357048, 0.022534826770424843, -0.012321182526648045, 0.020790942013263702, -0.0005712905549444258, 0.01716015674173832, -0.015506798401474953, -0.020263779908418655, 0.027628466486930847, -0.048213884234428406, -0.01440858468413353, 0.024326523765921593, 0.035181451588869095, 0.01829960197210312, -0.0010807595681399107, -0.10091307014226913, 0.0013000015169382095, 0.010649971663951874, -0.012803155928850174, -0.00623541884124279, 0.0030524402391165495, 0.031997520476579666, -0.0479624904692173, 0.023386532440781593, 0.038949932903051376, 0.01899596117436886, -0.01631159894168377, -0.037012483924627304, 0.0005255017313174903, -0.02796507440507412, 0.037090860307216644, -0.041118208318948746, -0.016549648717045784, -0.002138399053364992, -0.0029908691067248583, 0.04298102483153343, -0.0010648686438798904, 0.011540111154317856, 0.0693005621433258, -0.016165293753147125, -0.048850975930690765, -0.02104140631854534, -0.007363971322774887, -0.05243653059005737, 0.08469559997320175, -0.0037881575990468264, -0.0766783282160759, 0.009235277771949768, -0.02016359381377697, -0.025393923744559288, 0.027204521000385284, -0.008212247863411903, -0.05311604589223862, -0.013440079987049103, 0.07083548605442047, 0.06764935702085495, 0.06118404492735863, 0.004739923402667046, -0.0028226475697010756, 0.04075507074594498, 0.0009841595310717821, 0.01394179742783308, 0.010418115183711052, 0.0443575344979763, -0.0043410067446529865, 0.05488133057951927, 0.04761570319533348, -0.006142754107713699, -0.032771360129117966, -0.01009436510503292, 0.00020361639326438308, 0.016998646780848503, -0.06638118624687195, 0.016243087127804756, -0.01828029938042164, -0.02828191965818405, -0.04539020359516144, -0.006909821182489395, 0.05030997097492218, 0.02297705039381981, -0.029354918748140335, -0.01401875913143158, -0.01328654307872057, 0.006031442433595657, 0.02784154750406742, 0.0820874273777008, -0.017764581367373466, 0.026277679949998856, 0.014484655112028122, -0.004931333940476179, -0.016872495412826538, 0.05421936884522438, -0.017241600900888443, 0.053953226655721664, -0.028710862621665, -0.024811530485749245, 0.026970049366354942, 0.019151512533426285, 0.04370948299765587, -0.04606185853481293, -0.0050175245851278305, -0.04091022536158562, -0.052698392421007156, -0.0015146104851737618, -0.027602683752775192, 0.04426703229546547, -0.023361701518297195, 0.04206910356879234, 0.023789217695593834, -0.014457314275205135, 0.015366791747510433, -0.005997451487928629, -0.030782420188188553, -0.015110991895198822, -0.0238676518201828, 0.024765077978372574, 0.037628430873155594, 0.03356735035777092, 0.005049418658018112, 0.021585624665021896, 0.02584012970328331, 0.006426939740777016, -0.02984933741390705, -0.03174006566405296, -0.010222319513559341, 0.01894124411046505, -0.01380349975079298, 0.00879846140742302, 0.0007312619127333164, 0.0074330661445856094, 0.03250903636217117, -0.022670526057481766, 0.021748023107647896, 0.002609694143757224, -0.026880793273448944, -0.030910685658454895, 0.015425484627485275, 0.03198174387216568, 0.027450110763311386, 0.0667022094130516, 0.06225328519940376, 0.045172251760959625, -0.02593078836798668, -0.013242886401712894, 0.01722714863717556, -0.047025181353092194, -0.006430337205529213, -0.03448444977402687, 0.02143877185881138, -0.04237612709403038, -0.0075806304812431335, -0.005641911644488573, 0.02045263908803463, 0.049789343029260635, -0.06252089887857437, 0.007084944285452366, 0.03425498679280281, 0.02207193151116371, -0.009805301204323769, 0.01582730934023857, -0.021127404645085335, -0.0028000951278954744, -0.06496037542819977, -0.05082981660962105, 0.07644397020339966, -0.00894775241613388, 0.005642164032906294, 0.033381007611751556, 0.008171053603291512, -0.00634293258190155, -0.010032957419753075, -0.016504157334566116, -0.0069826762191951275, -0.0026744671631604433, -0.036740925163030624, -0.02306957356631756, 0.02995642088353634, -0.0170246884226799, 0.054385941475629807, -0.06325546652078629, -0.04924826696515083, -0.02586081251502037, -0.020160365849733353, -0.0127157773822546, 0.02627604268491268, -0.032294388860464096, -0.0068998741917312145, -0.02531103976070881, -0.001192122115753591, 0.0174278412014246, -0.06666164100170135, -0.028393849730491638, 0.03333339840173721, -0.017759643495082855, -0.004783147014677525, 0.001336350105702877, 0.0011179420398548245, -0.03380526229739189, -0.005138414911925793, 0.013565940782427788, 0.052995748817920685, 0.03208218142390251, -0.033728763461112976, 0.02502729929983616, -0.00955712329596281, 0.019603176042437553, -0.05215359106659889, -0.0079630883410573, 0.005637116264551878, -0.013899381272494793, -0.07185789197683334, -0.014747485518455505, -0.0031952611170709133, 0.0521264486014843, -0.013447451405227184, -0.019303034991025925, 0.018459735438227654, -0.02259201556444168, -0.06487542390823364, 0.02087888866662979, -0.01615038700401783, 0.024835461750626564, -0.05635447800159454, -0.06425397098064423, 0.02342054434120655, -0.06120093911886215, 0.005807111039757729, 0.05234396457672119, -0.05091038718819618, -0.005448946729302406, -0.003059975802898407, -0.019229181110858917, -0.0017923355335369706, -0.004358982667326927, -0.07148871570825577, 0.017554571852087975, -0.051859207451343536, -0.03962088003754616, -0.05782238021492958, 0.013061724603176117, -0.016979943960905075, 0.008871389552950859, -0.031443625688552856, 0.010721049271523952, -0.019056100398302078, 0.03499418869614601, -0.013891531154513359, -0.0017432714812457561, -0.03243130445480347, 0.06898123770952225, 0.0019439986208453774, -0.0566832460463047, -0.0010715716052800417, 0.01396943535655737, -0.04699184000492096, 0.08343231678009033, -0.013136052526533604, -0.00897250510752201, 0.042116064578294754, -0.07011131197214127, -0.09150230139493942, 0.008729765191674232, 0.008298053406178951, 0.029877396300435066, -0.009275317192077637, -0.06669589877128601, -0.030541421845555305, -0.01290455274283886, 0.07714316993951797, -0.03634316846728325, 0.029533054679632187, -0.08537174016237259, -0.07660948485136032, -0.006221882998943329, 0.012172413058578968, 0.0027667866088449955, -0.010950042866170406, -0.039765335619449615, 0.01913227140903473, 0.05252402275800705, -0.01957257091999054, 0.006748126354068518, 0.067057766020298, 0.039613205939531326, 0.06874256581068039, 0.020465927198529243, -0.018584299832582474, 0.05012731999158859, -0.02165297605097294, 0.02122020162642002, 0.01895328238606453, 0.02559075504541397, 0.027154546231031418, 0.023246845230460167, 0.02359033189713955, 0.03432029113173485, -0.055654074996709824, -0.05214504897594452, -0.07382120937108994, -0.010888789780437946, 0.04199296236038208, -0.0014486832078546286, 0.023010097444057465, 0.007391890045255423, 0.02220732718706131, 0.004582633264362812, -0.00926963146775961, -0.015438133850693703, -0.003055534092709422, -0.0012484337203204632, 0.01133444532752037, 0.05307599529623985, -0.01622915454208851, -0.02679809182882309, 0.011627701111137867, 0.06049644574522972, 0.04873518645763397, 0.015325881540775299, -0.021680617704987526, -0.010460822843015194, 0.04161784052848816, -0.00440569594502449, -0.023822329938411713, 0.010708626359701157, 0.009649300016462803, 0.010070543736219406, -0.053447175770998, -0.08661019057035446, -0.008657661266624928, -0.019651001319289207, -0.07673193514347076, -0.024407662451267242, 0.008311137557029724, 0.014871046878397465, -0.03502223640680313, -0.003636294510215521, 0.0232214517891407, 0.02161519229412079, 0.05408598110079765, -0.0013672326458618045, 0.0386587493121624, -0.03457057476043701, 0.01617887057363987, 0.0035463867243379354, -0.053948093205690384, 0.023696405813097954, -0.046181708574295044, 0.02027798257768154, 0.017799638211727142, 0.028929103165864944, 0.07632272690534592, -0.001292663742788136, 0.02946043573319912, 0.06067404896020889, 0.0026733390986919403, -0.040434904396533966, -0.03884672746062279, -0.008713511750102043, -0.011987132020294666, 0.07159080356359482, -0.052988167852163315, -0.00925134215503931, -0.02274101786315441, 0.032707344740629196, 0.03758402541279793, 0.05949666351079941, -0.05186138674616814, -0.02864171378314495, -0.012310110963881016, -0.016133014112710953, -0.07249660044908524, -0.028952818363904953, 0.030871430411934853, -0.006274258717894554, -0.0047253030352294445, -0.03838859125971794, -0.04067908599972725, -0.0003812877694144845, -0.02581445500254631, -0.0005682666669599712, 0.062245532870292664, 0.03801370784640312, 0.06856836378574371, 0.030121183022856712, -0.004864421207457781, 0.020624220371246338, 0.02143593691289425, 0.011730085127055645, 0.0350654311478138, 0.05612150579690933, -0.017993280664086342, 0.015782231464982033, 0.026824407279491425, -0.011247977614402771, -0.04422269016504288, -0.012456481344997883, 0.023293955251574516, 0.040831200778484344, 0.014184180647134781, 0.0669415071606636, -0.01477051991969347, -0.009675604291260242, -0.012388607487082481, -0.02292412705719471, -0.034922245889902115, -0.0332196019589901, 0.00798263493925333]" .
_:Article_100000010036616 <Article.uri> "nyt://article/70c88a70-e850-57ce-b62b-b5ccd5c7c939" .
_:Article_100000010036616 <Article.url> "https://www.nytimes.com/2025/03/23/opinion/hooters-gay-family.html" .
_:Article_100000010036616 <Article.published> "2025-03-23"^^<xs:dateTime> .
_:Author_PeterRothpletz <dgraph.type> "Author" .
_:Author_PeterRothpletz <Author.name> "Peter Rothpletz" .
_:Author_PeterRothpletz <Author.article> _:Article_100000010036616 .
_:Topic_HomosexualityandBisexuality <dgraph.type> "Topic" .
_:Topic_HomosexualityandBisexuality <Topic.name> "Homosexuality and Bisexuality" .
_:Article_100000010036616 <Article.topic> _:Topic_HomosexualityandBisexuality .
_:Topic_MenandBoys <dgraph.type> "Topic" .
_:Topic_MenandBoys <Topic.name> "Men and Boys" .
_:Article_100000010036616 <Article.topic> _:Topic_MenandBoys .
_:Topic_Minorities <dgraph.type> "Topic" .
_:Topic_Minorities <Topic.name> "Minorities" .
_:Article_100000010036616 <Article.topic> _:Topic_Minorities .
_:Topic_Grandparents <dgraph.type> "Topic" .
_:Topic_Grandparents <Topic.name> "Grandparents" .
_:Article_100000010036616 <Article.topic> _:Topic_Grandparents .
_:Topic_BarsandNightclubs <dgraph.type> "Topic" .
_:Topic_BarsandNightclubs <Topic.name> "Bars and Nightclubs" .
_:Article_100000010036616 <Article.topic> _:Topic_BarsandNightclubs .
_:Topic_Discrimination <dgraph.type> "Topic" .
_:Topic_Discrimination <Topic.name> "Discrimination" .
_:Article_100000010036616 <Article.topic> _:Topic_Discrimination .
_:Topic_WaitersandWaitresses <dgraph.type> "Topic" .
_:Topic_WaitersandWaitresses <Topic.name> "Waiters and Waitresses" .
_:Article_100000010036616 <Article.topic> _:Topic_WaitersandWaitresses .
_:Topic_CustomerRelations <dgraph.type> "Topic" .
_:Topic_CustomerRelations <Topic.name> "Customer Relations" .
_:Article_100000010036616 <Article.topic> _:Topic_CustomerRelations .
_:Topic_Restaurants <dgraph.type> "Topic" .
_:Topic_Restaurants <Topic.name> "Restaurants" .
_:Article_100000010036616 <Article.topic> _:Topic_Restaurants .
_:Organization_Hooters <dgraph.type> "Organization" .
_:Organization_Hooters <Organization.name> "Hooters" .
_:Article_100000010036616 <Article.org> _:Organization_Hooters .
_:0769f696-2e07-4fa9-9ee7-9992ec28ecb7 <dgraph.type> "Image" .
_:0769f696-2e07-4fa9-9ee7-9992ec28ecb7 <Image.caption> "" .
_:0769f696-2e07-4fa9-9ee7-9992ec28ecb7 <Image.url> "https://static01.nyt.com/images/2025/03/23/opinion/23rothpletz-image/23rothpletz-image-thumbStandard.jpg" .
_:0769f696-2e07-4fa9-9ee7-9992ec28ecb7 <Image.article> _:Article_100000010036616 .
_:Article_100000010065487 <dgraph.type> "Article" .
_:Article_100000010065487 <Article.title> "Keir Starmer on Putin, Trump and Europe’s Challenge: ‘We’ve Known This Moment Was Coming’" .
_:Article_100000010065487 <Article.abstract> "The British prime minister said in a series of conversations that the tectonic shifts in America’s relationship with Europe and Russia had to be a ‘galvanizing moment.’" .
_:Article_100000010065487 <Article.embedding> "[0.03844505548477173, 0.07636579126119614, -0.17925383150577545, -0.060283005237579346, 0.09450335800647736, 0.08512014150619507, -0.04725240543484688, -0.011987130157649517, 0.10811272263526917, 0.004162799101322889, -0.046916455030441284, 0.005835940595716238, 0.026204774156212807, 0.04270274192094803, 0.07855269312858582, -0.011884406208992004, 7.772394747007638e-05, -0.008268059231340885, -0.0261436328291893, 0.07816407829523087, -0.04919285327196121, -0.02885843627154827, -0.03130157291889191, -0.0011279013706371188, 0.031473539769649506, 0.04811226949095726, -0.009682913310825825, -0.01267898827791214, -0.00627406919375062, 0.005060948897153139, 0.054132331162691116, -0.0702853575348854, -0.04827414080500603, 0.025325147435069084, -0.056018341332674026, -0.08378830552101135, 0.010787742212414742, 0.013430659659206867, 0.0005711800185963511, -0.0456726960837841, 0.03540033847093582, -0.01763269118964672, 0.028341809287667274, -0.01965281367301941, 0.11271078884601593, -0.039632681757211685, -0.0273272767663002, 0.003641213057562709, 0.002082579769194126, 0.012734624557197094, 0.041685592383146286, -0.009500558488070965, 0.03355114907026291, -0.046966101974248886, 0.015633475035429, 0.04660460725426674, 0.05902770161628723, 0.036763787269592285, 0.0814933031797409, -0.004248685669153929, 0.042516786605119705, -0.020677320659160614, 0.017574327066540718, 0.0372711718082428, -0.02985551580786705, 0.02087385766208172, -0.05018632486462593, 0.016617167741060257, -0.020081115886569023, -0.03470107540488243, 0.02153831347823143, -0.06690581142902374, 0.022005030885338783, 0.0016621252289041877, -0.07232467830181122, 0.0054436735808849335, -0.027521144598722458, 0.002254914492368698, 0.010470515117049217, -0.011386080645024776, -0.006606141105294228, -0.026771357282996178, 0.053344693034887314, -0.038877878338098526, 0.03931937366724014, 0.009955876506865025, 0.00764126842841506, -0.015620646066963673, -0.014465299434959888, 0.0711364820599556, 0.0009931311942636967, 0.006040097679942846, -0.010705693624913692, 0.010083582252264023, -0.04680498316884041, 0.014012373052537441, -0.027410490438342094, 0.0030457156244665384, -0.032024335116147995, -0.037473756819963455, -0.06954562664031982, -0.009597033262252808, -0.0305315013974905, -0.012795956805348396, 0.03783068433403969, 0.009434417821466923, -0.021220626309514046, -0.06509071588516235, 0.06025920808315277, -0.014632700011134148, -0.04085731506347656, 0.02596389688551426, -0.003016263712197542, -0.004701754543930292, 0.0005250522517599165, -0.021902550011873245, 0.03496294096112251, -0.06881450861692429, 0.02476133592426777, 0.023423224687576294, -0.009489755146205425, -0.03722422569990158, -0.048537783324718475, 0.05984664335846901, 0.009813516400754452, 0.006711984518915415, -0.027787989005446434, 0.015120003372430801, 0.03172286972403526, -0.01398511789739132, -0.01396133191883564, -0.05187802389264107, 0.029849527403712273, 0.031674645841121674, 0.024630878120660782, 0.0716065838932991, 0.02379501610994339, -0.050658416002988815, 0.06353044509887695, 0.017230071127414703, 0.02118416130542755, -0.027807505801320076, -0.02102433517575264, -0.030831564217805862, 0.018789220601320267, -0.008016354404389858, 0.004372604191303253, -0.026428809389472008, -0.027510831132531166, 0.025779062882065773, -0.007645316421985626, 0.009753151796758175, 0.01130822952836752, 0.03967949002981186, 0.017944451421499252, -0.017476540058851242, -0.04556265473365784, -0.035325102508068085, -0.007415683474391699, 0.013441420160233974, -0.010374687612056732, -0.02972010336816311, -0.03536253049969673, 0.00621851347386837, 0.07166119664907455, -0.018657894805073738, 0.06119949743151665, -0.008114966563880444, 0.0196980033069849, 0.008937261998653412, -0.02509445697069168, -0.03382634371519089, 0.00555207347497344, -0.025611257180571556, 0.0491844117641449, -0.005990438163280487, 0.05216972902417183, -0.06475377082824707, 0.01543730404227972, -0.02704549953341484, -0.02561771497130394, -0.009284179657697678, 0.007990751415491104, -0.00729716382920742, 0.01707316003739834, 0.01726623624563217, 0.009641592390835285, -0.017518162727355957, -0.050316598266363144, -0.00760229816660285, -0.06870924681425095, -0.045620426535606384, -0.07663740962743759, -0.044050924479961395, 0.002831107471138239, -0.032212331891059875, 0.06065453588962555, -0.0028429394587874413, 0.02015155367553234, -0.03274241089820862, -0.03218305483460426, -0.006381430197507143, -0.003796267556026578, -0.018376315012574196, -0.03040182590484619, 0.07123393565416336, -0.004804182332009077, 0.06684370338916779, -0.04882102832198143, -0.008503529243171215, 0.11305341869592667, 0.003574226051568985, -0.06112193688750267, -0.017669592052698135, -0.04167180508375168, -0.009087015874683857, 0.030903460457921028, 0.0015554066048935056, -0.011840010061860085, 0.057711441069841385, 0.014446022920310497, 0.028125913813710213, -0.014918865635991096, 0.031306054443120956, 0.02444293722510338, -0.013466287404298782, -0.0066071767359972, -0.0489385649561882, -0.06647160649299622, -0.025786276906728745, -0.02981436811387539, -0.011536644771695137, 0.06672244518995285, 0.07018033415079117, -1.5979880117811263e-05, 0.0723831057548523, -0.004187389742583036, -0.0055135032162070274, -0.05096058174967766, 0.022205445915460587, 0.0001836482115322724, 0.0237989891320467, -0.032946277409791946, -0.0272342711687088, -0.06393428891897202, 0.014144998043775558, 0.06454072147607803, 0.0002518698456697166, 0.02413320727646351, 0.010736757889389992, 0.01889920048415661, -0.03518029302358627, 0.0016439720056951046, 0.008247029036283493, 0.06331068277359009, -0.03204202279448509, 0.007197816856205463, 0.08424293994903564, -0.021299416199326515, 0.014603376388549805, 0.0285047460347414, -0.07624081522226334, 0.028387749567627907, -0.05089748278260231, -0.04387236386537552, -0.03574574738740921, -0.054782379418611526, -0.0037911906838417053, -0.0007944093667902052, -0.029455212876200676, 0.018193209543824196, 0.03379131108522415, 0.013649944216012955, 0.05300067365169525, -0.06005827710032463, -0.06914233416318893, 0.05010276287794113, -0.04695774242281914, 0.008281688205897808, 0.0369732566177845, -0.077333964407444, -0.0019991062581539154, 0.005980496760457754, -0.04044845700263977, 0.0343758761882782, 0.05280398204922676, 0.03261026740074158, 0.06792117655277252, 0.008703355677425861, -0.003155668033286929, -0.02623511105775833, 0.011025219224393368, 0.023732738569378853, 0.005566105246543884, -0.0026655991096049547, 0.012657584622502327, 0.11563650518655777, -0.04279307276010513, -0.020531674847006798, -0.018739311024546623, 0.04747040197253227, 0.019236646592617035, 0.02522328309714794, 0.051702164113521576, -0.015338333323597908, -0.013617332093417645, 0.0005034189671278, -0.04423445835709572, 0.00564187066629529, 0.004602217581123114, -0.07088879495859146, 0.017224745824933052, 0.0028656329959630966, 0.03375406190752983, -0.05940311774611473, 0.039947569370269775, 0.04877891764044762, 0.04039129242300987, 0.07032524794340134, 0.02921372652053833, -0.040166426450014114, -0.044374097138643265, 0.004533571656793356, -0.05290539935231209, 0.002224802738055587, 0.048265211284160614, 0.02192424051463604, 0.02788914181292057, -0.04388808831572533, 0.03186579421162605, -0.026981906965374947, -0.02378624863922596, 0.025926606729626656, -0.01011835876852274, -0.0865836814045906, 0.015703842043876648, 0.03237288072705269, 0.0435318686068058, -0.001058355439454317, 0.054630156606435776, 0.06908876448869705, -0.035887520760297775, -0.003821965539827943, -0.014712457545101643, 0.02374921180307865, 0.056681156158447266, -0.04571259021759033, -0.006173490080982447, 0.034006938338279724, 0.014482498168945312, -0.050568122416734695, 0.033833641558885574, -0.026705151423811913, 0.011991054750978947, 0.0310763418674469, -0.04499752074480057, 0.015618817880749702, 0.028986413031816483, -0.03798085078597069, 0.0029996493831276894, 0.024745160713791847, -0.06326974928379059, 0.0032765581272542477, -0.053207170218229294, -0.007604439277201891, 0.043364930897951126, -0.010747242718935013, 0.008723834529519081, 0.020853746682405472, -0.010677095502614975, -0.033470723778009415, -0.01244442630559206, -0.03436557576060295, 0.060874540358781815, -0.0006514934357255697, -0.014557842165231705, -0.04280085116624832, -0.053018420934677124, -0.025878766551613808, 0.009244904853403568, -0.021297641098499298, -0.005134535953402519, -0.021578889340162277, 0.062442392110824585, 0.023600362241268158, -0.036776237189769745, 0.02443988248705864, -0.026911212131381035, 0.025626663118600845, 0.023873068392276764, 0.008560086600482464, -0.007205820642411709, -0.00672499556094408, 0.021309154108166695, 0.04195505008101463, -0.032293159514665604, 0.011010829359292984, -0.002304373774677515, -0.005056323017925024, 0.0193804744631052, -0.021752895787358284, -0.049106284976005554, 0.01711018942296505, -0.04399949312210083, -0.022982409223914146, -0.03620028868317604, -0.01840887777507305, -0.017193960025906563, 0.005912794265896082, -0.035019148141145706, 0.02515900880098343, 0.07394913583993912, -0.002435187343508005, -0.03354061394929886, -0.012639433145523071, 0.049173127859830856, 0.02578299678862095, -0.007110254373401403, 0.00105610815808177, 0.022694462910294533, 0.021862376481294632, 0.034030791372060776, -0.03858620673418045, -0.005369647406041622, -0.006969386711716652, 0.06811132282018661, 0.01059641968458891, 0.002102574100717902, -0.010851910337805748, -0.010260705836117268, 0.014888975769281387, 0.002270362339913845, 0.016220251098275185, 0.04257821664214134, 0.005559847224503756, -0.013570710085332394, -0.030071182176470757, -0.03467671200633049, 0.006316699553281069, 0.03961784020066261, 0.03821852058172226, -0.05957864224910736, -0.03049008548259735, 0.0052987756207585335, 0.04283441603183746, 0.08791369199752808, 0.006392827257514, -0.013444813899695873, 0.004481463693082333, -0.010499962605535984, -0.020620742812752724, -0.022257767617702484, 0.040660109370946884, 0.01686207763850689, 0.11074643582105637, -0.06640872359275818, -0.00680095748975873, 0.01756729744374752, -0.018144994974136353, 0.028141235932707787, 0.032694075256586075, -0.006639935541898012, -0.03068622760474682, 0.00024925588513724506, 0.00021193758584558964, -0.03204856440424919, -0.01697721891105175, 0.01240029651671648, -0.003894924186170101, 0.008309927769005299, -0.019274862483143806, -0.019809255376458168, 0.01395460031926632, 0.013894527219235897, -0.024968452751636505, 0.016831757500767708, 0.003105226904153824, -0.014886352233588696, 0.035570178180933, 0.009673748165369034, 0.0024378846865147352, 0.014410915784537792, -0.0022296567913144827, -0.08784309029579163, 0.0074518355540931225, 0.04522135481238365, -0.029826875776052475, -0.03690754622220993, 0.01711484044790268, 0.012354161590337753, 0.0667693167924881, 0.003041821299120784, 0.03714225813746452, -0.039728716015815735, -0.0396820493042469, -0.012040255591273308, -0.0012564343633130193, 0.018843509256839752, 0.044799499213695526, 0.029582802206277847, 0.09428920596837997, 0.03767962381243706, -0.011117959395051003, 0.025662321597337723, -0.0029158296529203653, 0.0005014927010051906, 0.011330598033964634, -0.021604010835289955, -0.04815908148884773, 0.01191396452486515, -0.04546401649713516, -0.04145873710513115, 0.007963928394019604, 0.06885731220245361, 0.040511179715394974, -0.03690606355667114, -0.015934986993670464, 0.0006664845859631896, -0.037017207592725754, 0.022528499364852905, -0.004990845452994108, -0.05660581588745117, 0.023175794631242752, -0.051782526075839996, -0.056747086346149445, 0.06448924541473389, 0.02243473008275032, -0.017955634742975235, 0.013501548208296299, 0.028990983963012695, 0.01853189431130886, -0.0028339403215795755, -0.00631056958809495, -0.04126209020614624, 0.046551045030355453, -0.02064168080687523, -0.0354556106030941, 0.053068045526742935, 0.04046434164047241, 0.015235121361911297, 0.003318477887660265, 0.0005460634711198509, -0.0016277018003165722, -0.011648030951619148, -0.0022452932316809893, 0.03945936635136604, -0.013634431175887585, 0.013722969219088554, 0.0006385622546076775, -0.010562781244516373, 0.04051802679896355, -0.0710841491818428, 0.003945403732359409, -0.026527797803282738, 0.025707678869366646, -0.021358158439397812, -0.009077277034521103, -0.026929372921586037, -0.046378374099731445, -0.03179164603352547, 0.01971176639199257, -0.02798602357506752, 0.020892400294542313, 0.024473782628774643, -0.006844505667686462, 0.0166937243193388, -0.01816467195749283, 0.00889201182872057, -0.01799253188073635, 0.016493795439600945, 0.04776512458920479, -0.05545559898018837, -0.05501720309257507, -0.029948780313134193, -0.015412638895213604, -0.006748106796294451, -0.019058287143707275, 0.0036566832568496466, -0.0813547819852829, -0.017000041902065277, 0.015154518187046051, -0.057305313646793365, 0.0016426638467237353, 0.02681197039783001, -0.009343845769762993, 0.031025966629385948, -0.004014235455542803, -0.029225056990981102, 0.052242688834667206, -0.027783531695604324, 0.026111846789717674, -0.04416773095726967, -0.05179757997393608, -0.01558862067759037, -0.009159073233604431, 0.010884135961532593, -0.0630108192563057, -0.06707966327667236, -0.002454071771353483, 0.046298447996377945, 0.009236582554876804, 0.004048740025609732, 0.046672552824020386, -0.07376106828451157, -0.0039981999434530735, 0.01875123381614685, 0.041057292371988297, 0.02278219722211361, 0.0005818579229526222, 0.01927734725177288, 0.026047522202134132, 0.01287982240319252, -0.006448837928473949, -0.033341675996780396, 0.05408574640750885, 0.007422362919896841, 0.03579138219356537, -0.013823754154145718, -0.015462840907275677, -0.004588888492435217, -0.02745620720088482, -0.003904548939317465, -0.008950981311500072, -0.008824992924928665, 0.01119084469974041, 0.0213044174015522, -0.029826689511537552, -0.05468156933784485, -0.0025630949530750513, -0.003693606471642852, -0.04142187535762787, 0.03546494245529175, -0.06615901738405228, 0.04183974862098694, 0.03489655256271362, 0.016117125749588013, -0.0007733888342045248, -0.02511170506477356, -0.021818062290549278, 0.030588136985898018, 0.044128820300102234, -0.05835040658712387, -0.051896508783102036, 0.030797405168414116, -0.001549591077491641, -0.021855901926755905, -0.001680175308138132, 0.03934840112924576, 0.010804743506014347, 0.02078784815967083, 0.058408547192811966, 0.06778799742460251, 0.023949241265654564, 0.023814810439944267, 0.00607413612306118, -0.006246115081012249, 0.05676629766821861, -0.03645598888397217, 0.02217518538236618, 0.019346468150615692, 0.010305976495146751, 0.02182236686348915, -0.009824773296713829, -0.025553809478878975, -0.008461790159344673, 0.001635315828025341, 0.002692233771085739, -0.016894454136490822, -0.07222532480955124, -0.009191240184009075, -0.021173566579818726, -0.03552364930510521, -0.0195603184401989, 0.023747270926833153, -0.003987190779298544, 0.027919135987758636, 0.02770477719604969, 0.020746024325489998, 0.005641847383230925, 0.02115393429994583, 0.041486650705337524, -0.025568244978785515, 0.01617237739264965, -0.001985474256798625, -0.030577003955841064, -0.025666330009698868, 0.06116992235183716, 0.025920743122696877, -0.03193805366754532, -0.008035615086555481, 0.0018799984827637672, -0.03529380261898041, 0.06375309824943542, 0.0007972555467858911, 0.02548309974372387, -0.0005509566399268806, 0.010322043672204018, 0.012015985324978828, -0.010935385711491108, -0.023388825356960297, -0.028276488184928894, 0.041755933314561844, 0.004086868371814489, 0.03076338768005371, -0.04710046201944351, 0.019702795892953873, 0.05090884491801262, -0.04707377031445503, 0.027188709005713463, 0.033957310020923615, 0.010294615291059017, 0.01578410156071186, 0.024927731603384018, 0.0650545060634613, 0.07228132337331772, -0.013194338418543339, -0.015146752819418907, -0.06397505849599838, 0.009297121316194534, 0.044093724340200424, 0.017672190442681313, -0.0247164499014616, -0.06204550713300705, -0.034918759018182755, -0.03917444497346878, 0.023330578580498695, 0.03727742284536362, -0.07037705928087234, 0.022179745137691498, 0.005495485384017229, 0.04612633213400841, -0.02776387333869934, -0.0175042524933815, 0.016993792727589607, -0.026262084022164345, 0.0024328429717570543, -0.021243736147880554, 0.0342995747923851, -0.037287525832653046, -0.04175475984811783, -0.05783717706799507, -0.04104525223374367, 0.04808841273188591, 0.053918130695819855, -0.02307380735874176, 0.020321911200881004, 0.009267926216125488, 0.08746442943811417, 0.011410574428737164, 0.01066052820533514, -0.07266289740800858, -0.023231476545333862, -0.05683467537164688, -0.02124651148915291, -0.036801863461732864, 0.018860360607504845, -0.0360787995159626, 0.04180237650871277, 0.05456117168068886, -0.02182484045624733, 0.005693103186786175, -0.015506044961512089, 0.01792100816965103, -0.026798833161592484, -0.03371133282780647, -0.02671392634510994, -0.0377604216337204, 0.019002269953489304]" .
  }
}
Verify your graph
Run the following query in Ratel to verify your graph data is loaded:Copy
Ask AI
{
  articles(func:type(Article),first:100) {
    Article.title
    Article.uri
    Article.url
    Article.published
    Article.abstract
    Article.topic {
      Topic.name
    }
    Article.org {
      Organization.name
    }
    Article.geo {
      Geo.name
    }
  }
}
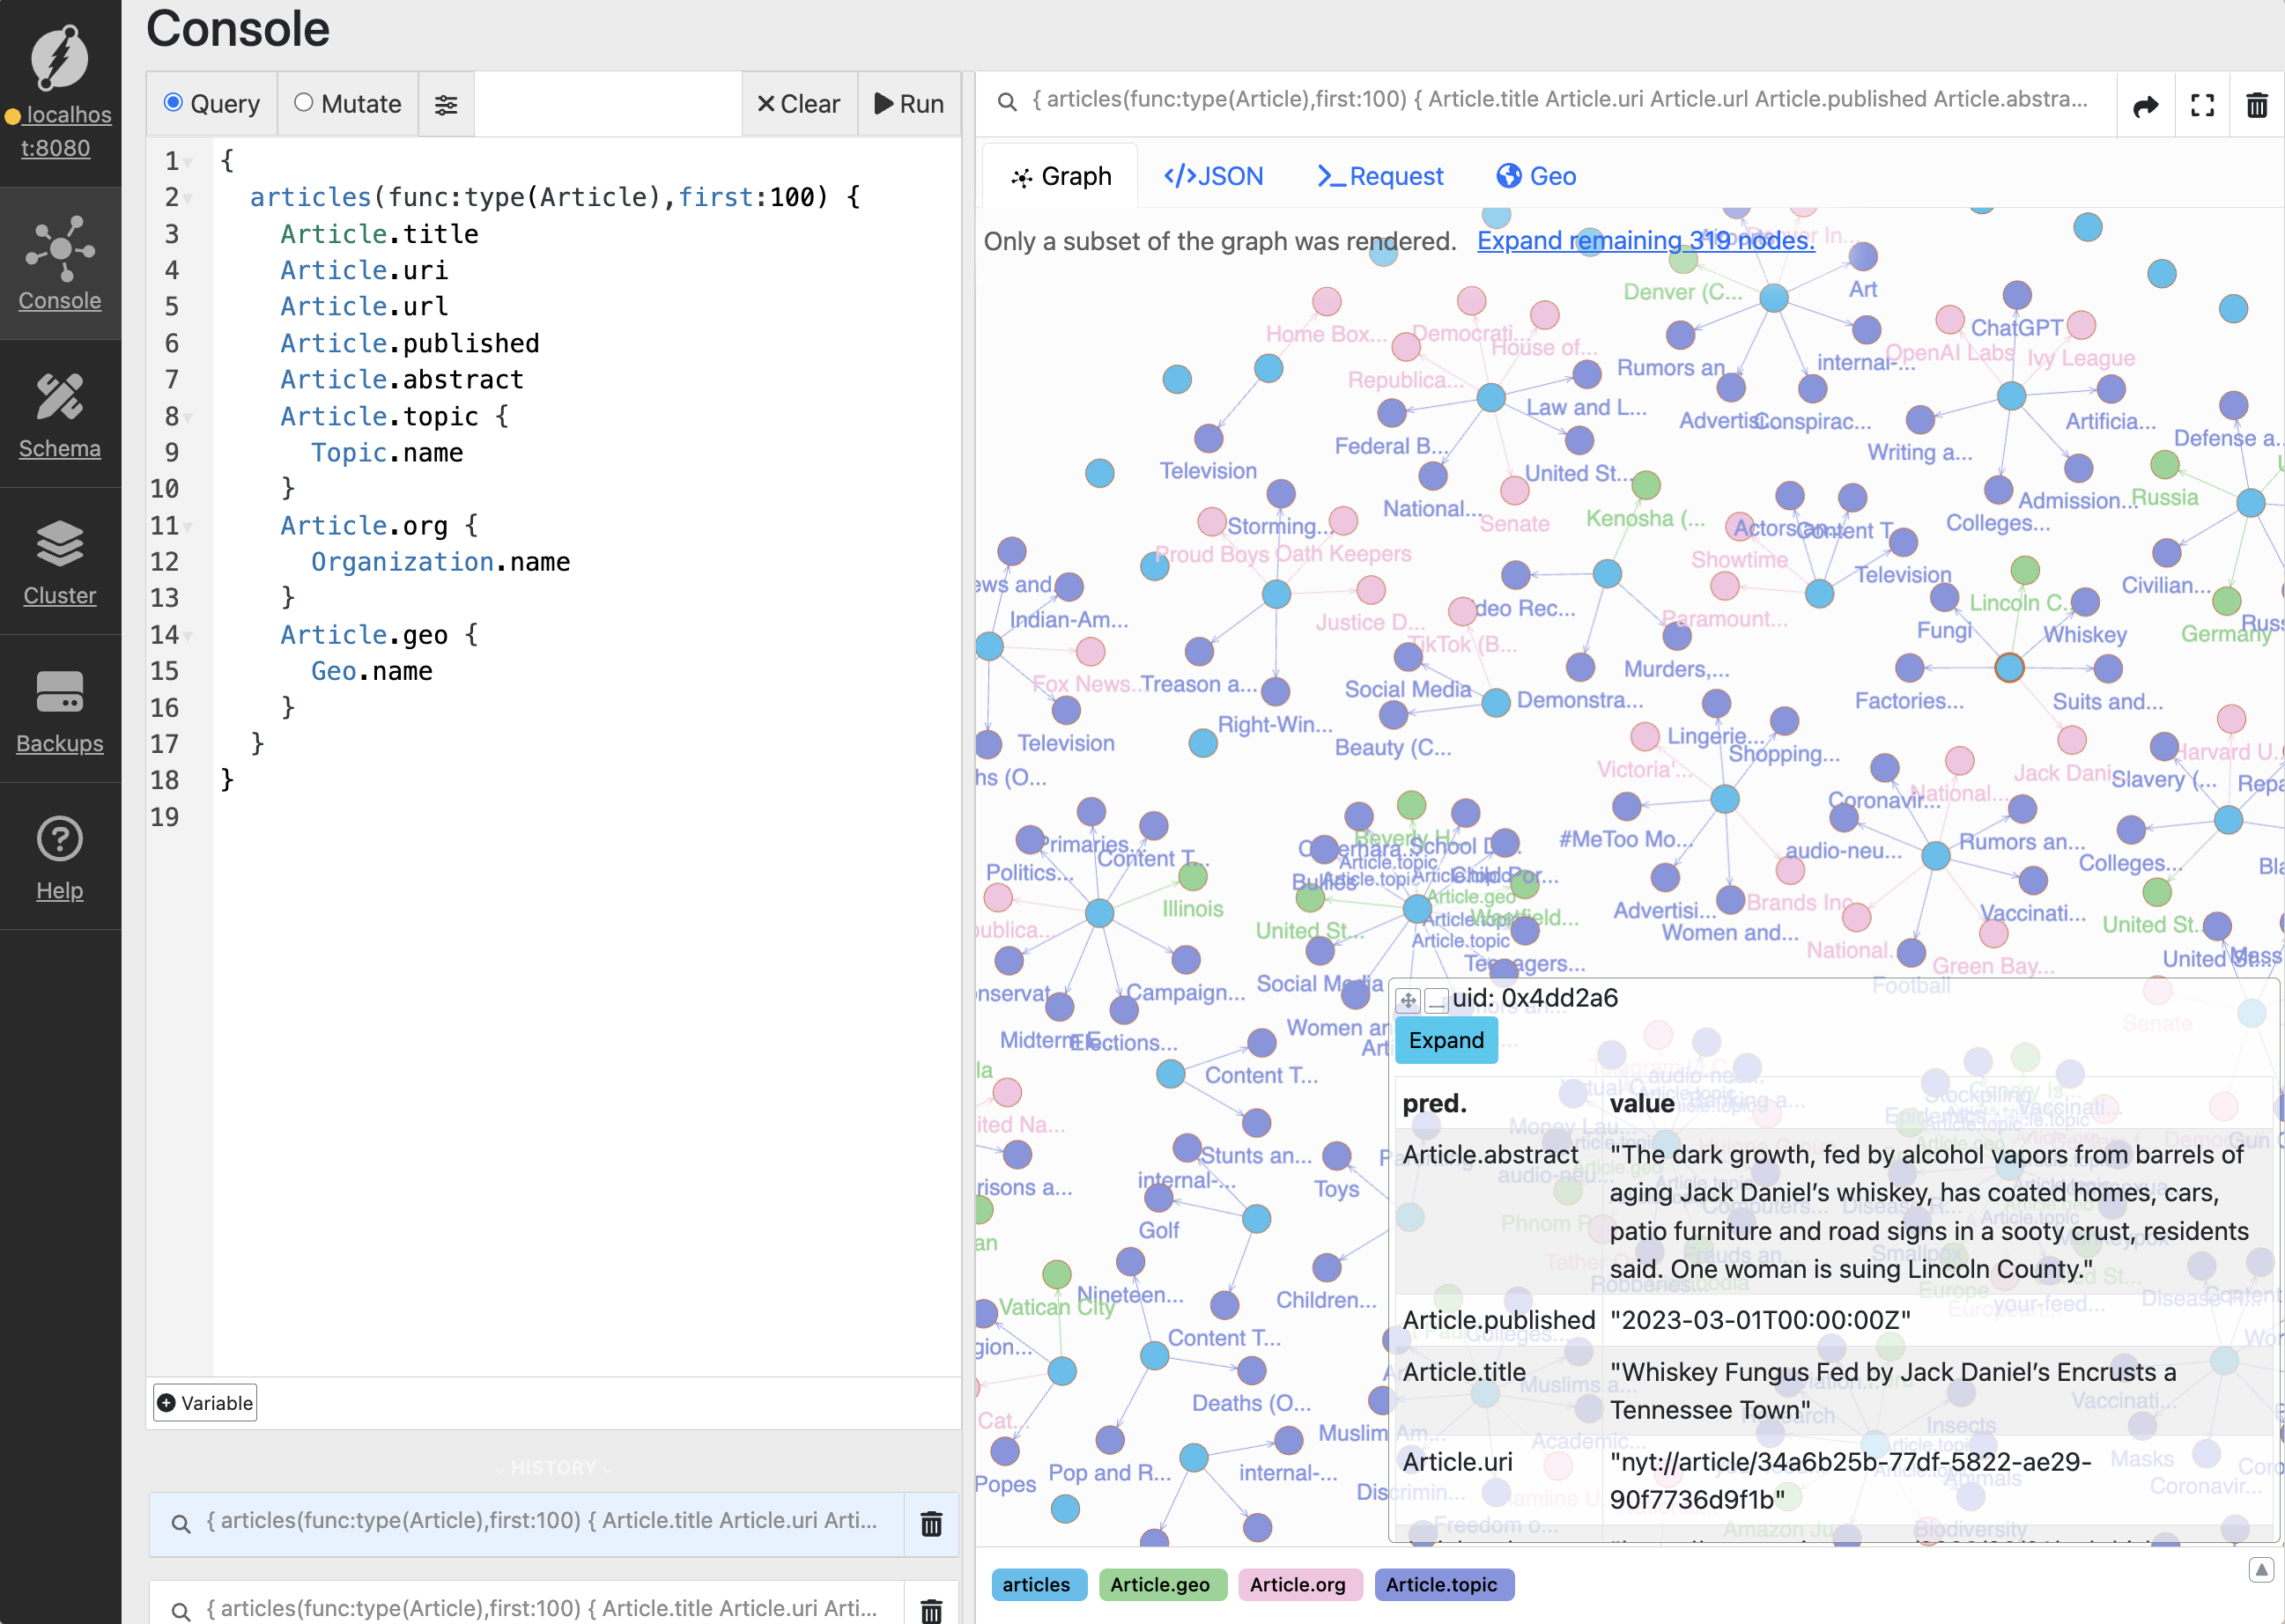
What you’ve accomplished
In 25 minutes, you’ve mastered advanced graph data modeling: Dgraph architecture: understood distributed graph databases and modern capabilities Real-world data modeling: worked with complex news article knowledge graphs Multi-type graphs: explored lexical, domain, visual, and geospatial graph patterns Advanced patterns: learned temporal modeling, multi-modal integration, and provenance tracking Agent integration: connected sophisticated graph capabilities to your agentsNext steps
In the nextTomorrow - Day 22
Master DQL (Dgraph Query Language) for complex graph queries and integrate
Dgraph with your agents using multiple client libraries.
Pro tip for today
Experiment with different graph modeling approaches:Copy
Ask AI
Help me understand when to use different knowledge graph types:

1. For a customer support system: What type of knowledge graph would be most effective?
2. For a research assistant: How would you model academic papers and citations?
3. For a business intelligence system: What relationships matter most for competitive analysis?
4. For a content recommendation system: How do you balance multiple types of similarity?

Show me schema examples and explain the reasoning behind each design choice.
Time to complete: ~25 minutes
- Skills learned Dgraph architecture, RDF data modeling, multi-type knowledge graphs, temporal and provenance patterns, agent integration strategies
Remember Advanced graph modeling is about representing not just what you
know, but how you know it, when you knew it, and how confident you are about
it. This metadata becomes crucial for agent reasoning.