We’re overhauling Dgraph’s docs to make them clearer and more approachable. If
you notice any issues during this transition or have suggestions, please
let us know.
Learning goals
In this tutorial, you’ll learn about graphs, and how a graph database is different from a database built on a relational data model. This tutorial doesn’t include any code or syntax, but rather a comparison of graphs and relational data models. By the end of this tutorial, you should be able to answer the following questions:- What’s a graph?
- How are graphs different from relational models?
- How’s data modeled in a graph?
- How’s data queried from a graph?
Graphs and natural data modeling
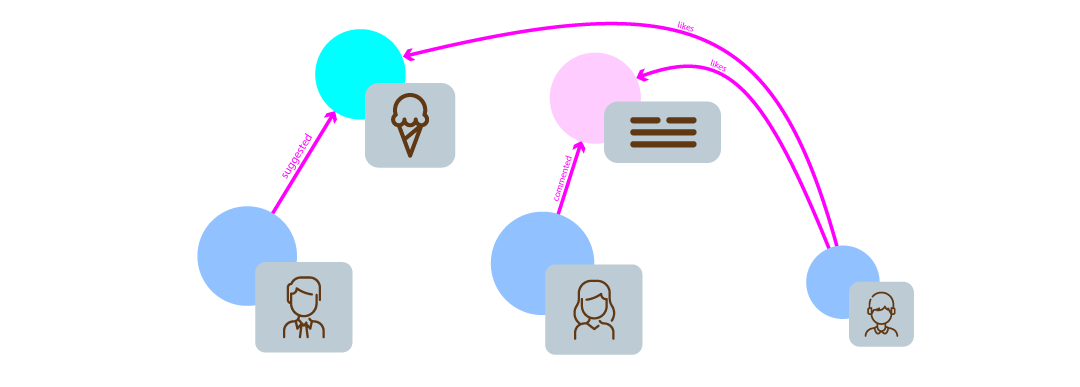
Graphs provide an alternative to tabular data structures, allowing for a more natural way to store and retrieve data. For example, you could imagine that we’re modeling a conversation within a family:- A
father, who starts a conversation about going to get ice cream. - A
mother, who comments that she would also like ice cream. - A
child, who likes the idea of the family going to get ice cream.
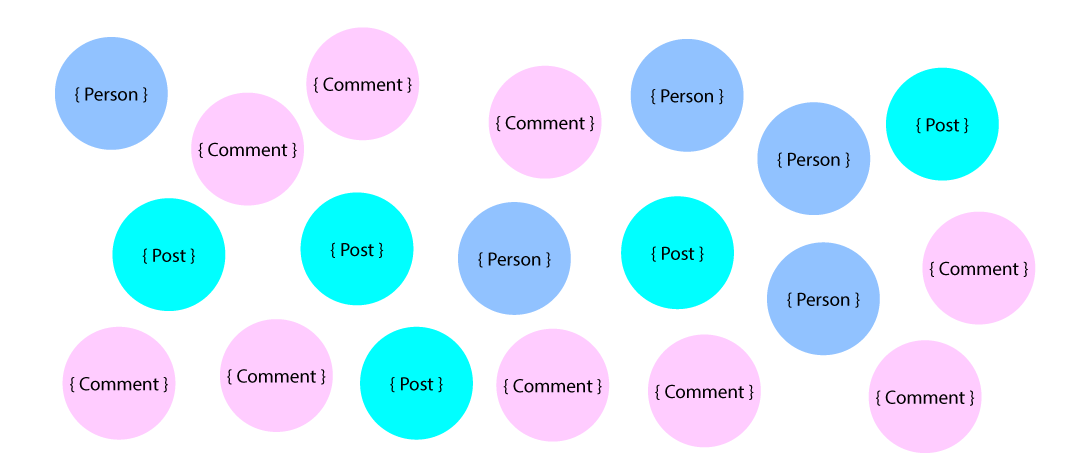
people, posts,
comments, and reactions.
A graph data model is different from a relational model. A graph focuses on the
relationships between information, whereas a relational model focuses on storing
similar information in a list. The graph model received its name because it
resembles a graph when illustrated.
- Data objects are called nodes and are illustrated with a circle.
- Properties of nodes are called predicates and are illustrated as a panel on the node.
- Relationships between nodes are called edges and are illustrated as
connecting lines. Edges are named to describe the relationship between two
nodes. A
reactionis an example of an edge, in which a person reacts to a post.
father, mother, child, post, and
comment are nodes. The name of the people, the post’s title, and text of the
comment are the predicates. The natural relationships between the authors of the
posts, authors of the comments, and the comments’ topics are edges.
As you can see, a graph models data in a natural way that shows the
relationships (edges) between the entities (nodes) that contain predicates.
Relational Data Modeling
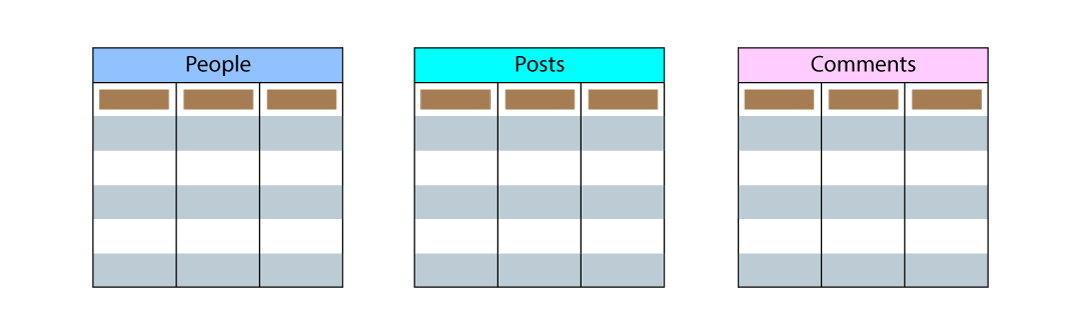
This section considers the example social media app introduced in the previous section and discusses how it could be modeled with a traditional relational data model, such as those used by SQL databases. With relational data models, you create lists of each type of data in tables, and then add columns in those tables to track the attributes of that table’s data. Looking back on our data, we remember that there are three main types,People, Posts, and Comments
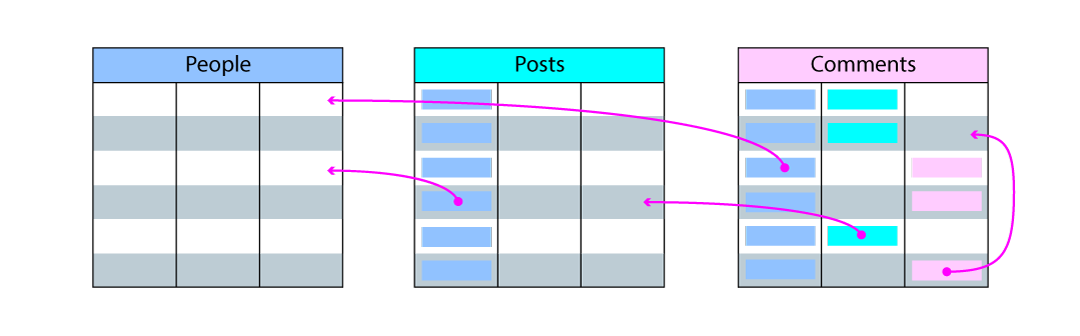
- The relationship from
PoststoPeople, to track contributors (authors, editors, etc.) of aPost - The relationship from
CommentstoPeople, to track the author of the comment - The relationship from
CommentstoPosts, to track on which post comments were made - The relationship between rows in the
Commentstable, to track comments made in reply to other comments (a self-reference relationship)
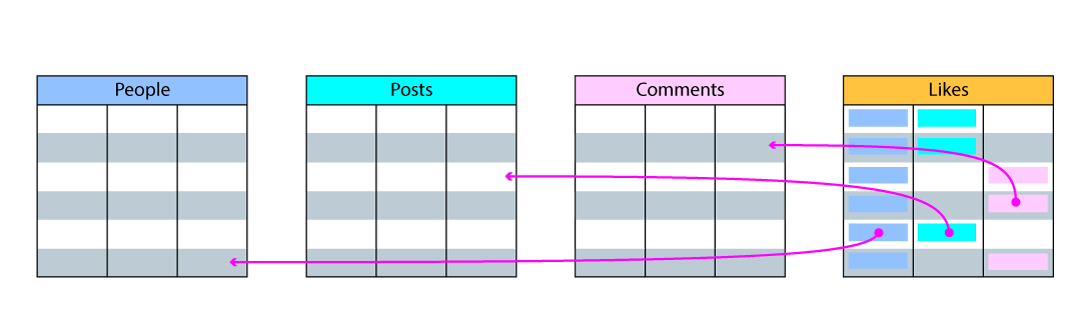
people_like_posts and people_like_comments
tables. None of these solutions is perfect, though, and there is a trade-off
between having a lower table count or having more empty fields in our tables
(also known as “sparse data”).
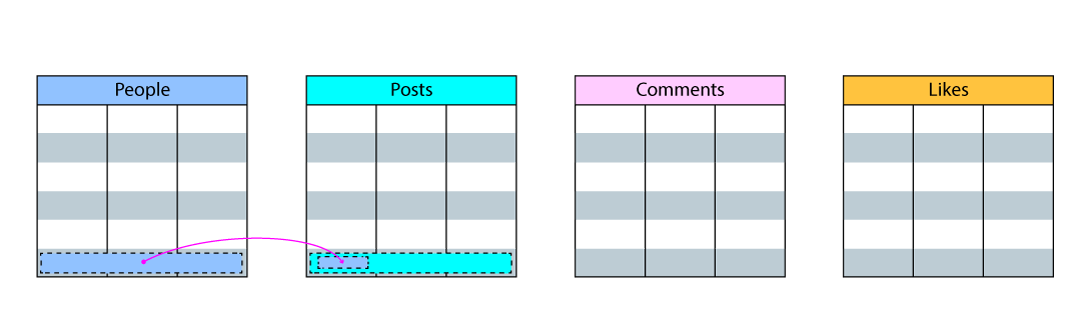
People table and then retrieve their primary key and associate it
with the new row in the Posts table.
Graph Data Modeling
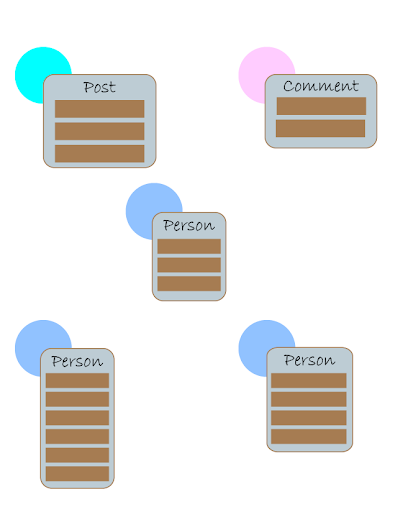
In this section we take our example social media app and see how it could be modeled in a graph. The concept of modeling data in a graph starts by placing dots, which represent nodes. Nodes can have one or more predicates (properties). Aperson may have
predicates for their name, age, and gender. A post might have a predicate
value showing when it was posted, and a value containing the contents of the
post. A comment would most likely have a predicate containing the comment
string. However, any one node could have other predicates that aren’t contained
on any other node. Each node represents an individual item, hence the singular
naming structure.
father
and the mother are linked together with a spouse edge, and both parents are
related to the child along a child edge.
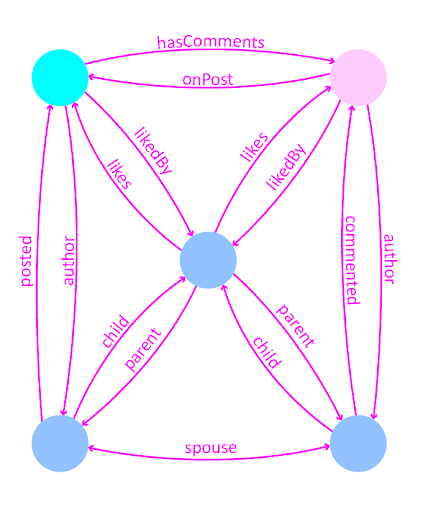
Post has an Author and a Person has
Posts. A Post has Comments and a Comment is on a Post. A Comment has
an Author, and a Person has Comments. A Parent has a Child, and a
Child has a Parent.
You create many-to-many relationships in the same way that you make one-to-many
relationships, with an edge between nodes.
Adding groups of related data occurs naturally within a graph. The data is sent
as a complete object instead of separate pieces of information that needs to be
connected afterwards. Adding a new person and a new post to our graph is a
one-step process. New data coming in doesn’t have to be related to any existing
data. You can insert this whole data object with 3 people, a post, and a comment
all in one step.
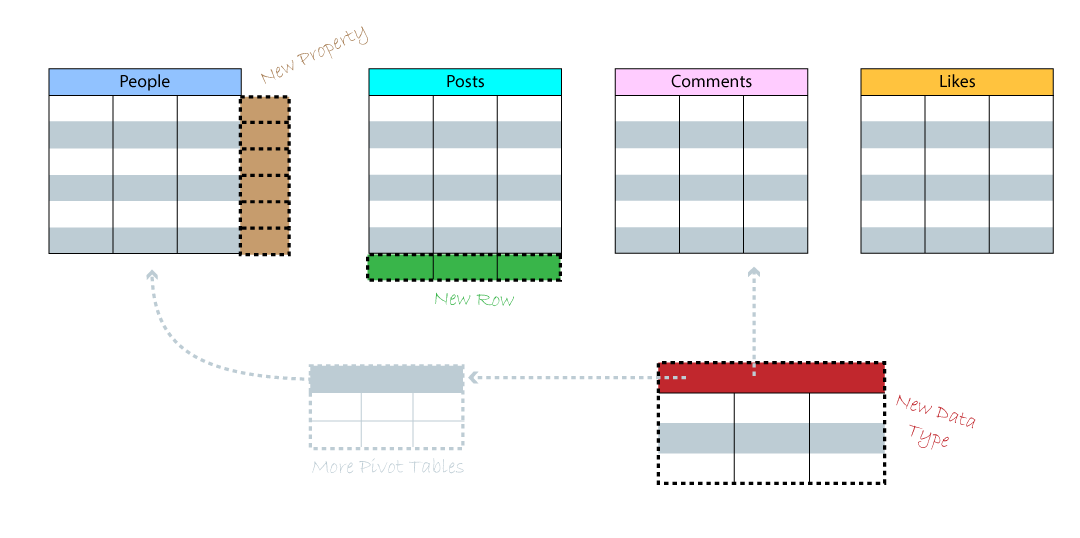
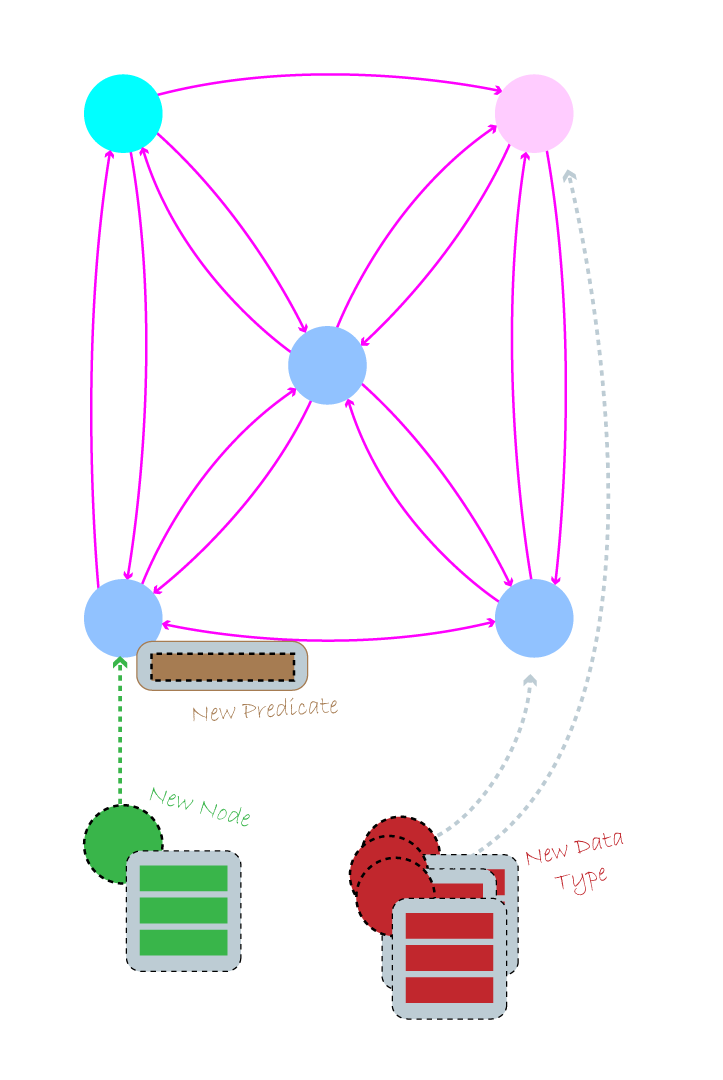
When new data is added to the model, the model changes to accept the data. Every
change to a graph model is received naturally. When you add a new node with a
data type, you are simply creating a new dot in space and applying a type to it.
The new node doesn’t include any predicates or relationships other than what you
define for it. When you want to add a new predicate onto an existing data type,
the model changes and adds the new property onto the items that you define.
Other items not specifically given the new property type aren’t changed. When
you add a new data type to the database, a new node is created, ready to receive
new edges and predicates.
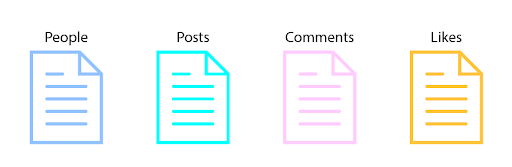
Query Data in a Relational Model
Storing our data is great, but the best data model would be useless without the ability to query the data our app requires. So, how does information get retrieved in a relational model compared to a graph model? In a relational model, tables are stored in files. To support the sample social media app described in this tutorial, you would need four files:People,
Posts, Comments, and Likes.
What’s an index?
An index is an algorithm used to find the location of data. Instead of scanning an entire file looking for a piece of data, an index is used to aggregate the data into “chunks” and then create a decision tree pointing to the individual chunks of data. Such a decision tree could look like the following: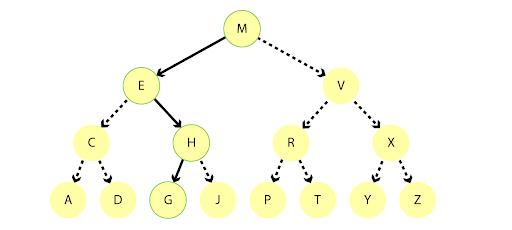
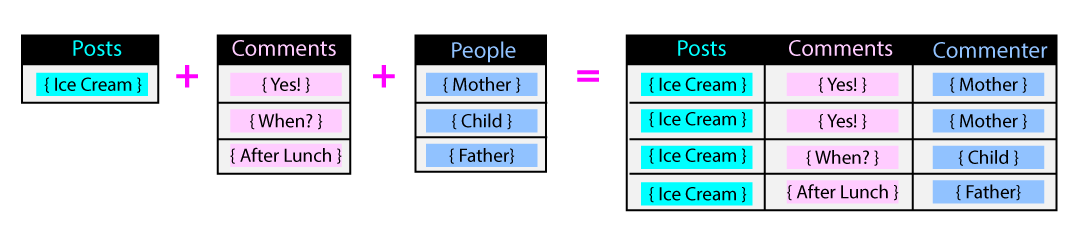
How data is joined in a relational model
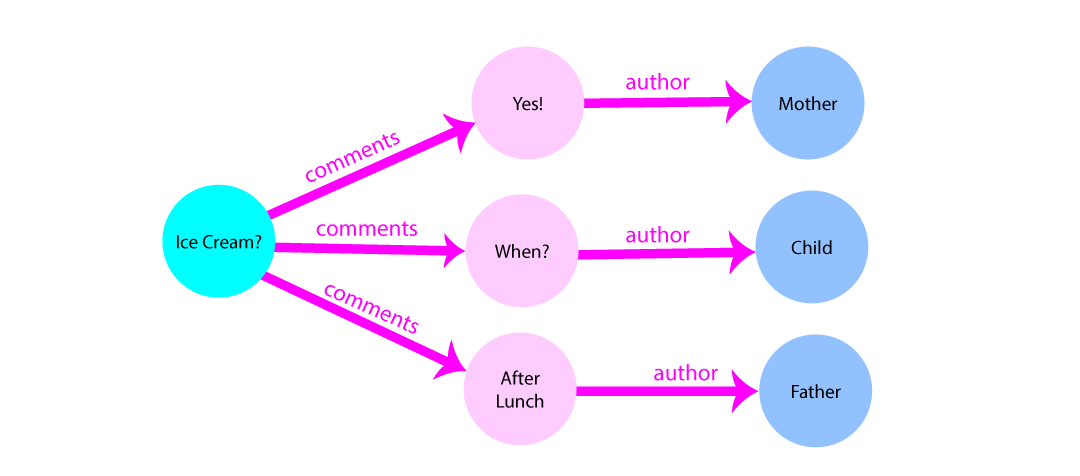
In a relational model, the request’s response must be returned as a single table consisting of columns and rows. To form this single table response, data from multiple tables must be joined together. In our app example, we found the post entitled “Ice Cream?” and also found the comments, “Yes!”, “When?”, and “After Lunch”. Each of these comments also has a corresponding author:Mother,
Child, and Father. Because there is only one post as the root of the join,
the post is duplicated to join to each comment.
person.

posts and duplicate comments. Another side effect of
this response approach is that it’s likely that empty data exists in the
response.
In the next section, you’ll see that querying a graph data model avoids the
issues that you would face when querying a relational data model.
Query Data in a Graph Model
As you’ll see in this section, the data model we use determines the ease with which we can query for different types of data. The more your app relies on queries about the relationships between different types of data, the more you benefit from querying data using a graph data model. In a graph data model, each record (aperson, post or comment) is stored
as a data object (sometimes also called a node). In the example social media
app described in this tutorial, there are objects for individual people, posts,
and comments.
post, “Ice Cream?”, we traverse the graph to arrive at the
post’s comments. To find the post’s author, we traverse the next step to
arrive at the people who authored the comment. This process follows the natural
progression of related data, and graph data models allow us to query our data to
follow this progression efficiently.
What do we mean by efficiently? A graph data model lets you traverse from one
node to a distantly related node without the need for anything like pivot
tables. This means that queries based on edges can be updated easily, with no
need to change the schema to support new many-to-many relationships. And, with
no need to build tables specifically for query optimization, you can adjust your
schema quickly to accommodate new types of data without adversely impacting
existing queries.
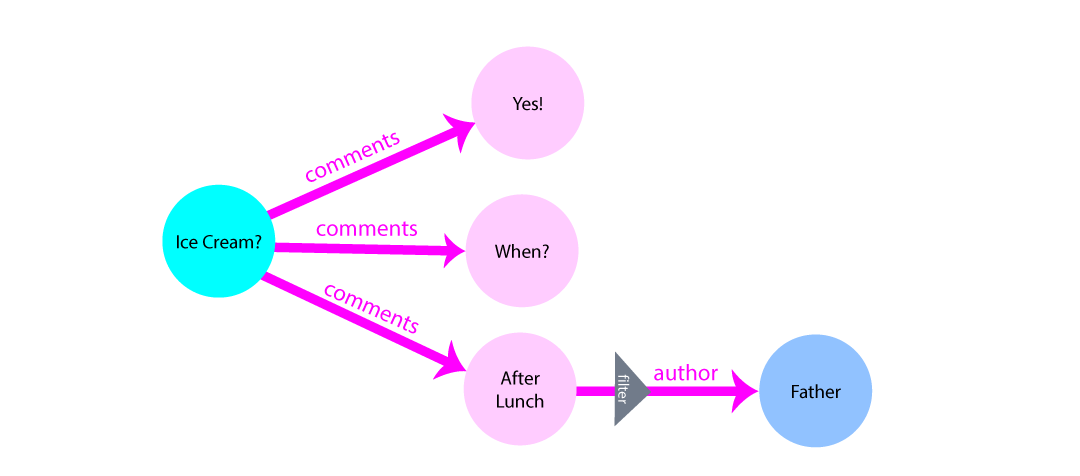
comment on your
post or the last person to like the comment, filters can be applied to the
edge.
Conclusion
Congratulations on finishing the Dgraph learn course Graph Data Models 101! Now that you have an overview and understanding of- what a graph is
- how a graph differs from a relational model
- how to model a graph
- and how to query a graph